


Statechart states and transitions can be involved in the steps executed by the simulation engine. Such shapes are highlighted at model runtime to help you to locate the current activity within the model.
The highlight colors and their meanings are given in the table below.
| Item | Color | Status |
|---|---|---|
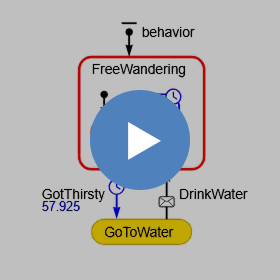
| State | Red |
Active. The control is at this state. If the active state lies inside one or more composite states, all of them are considered active and get highlighted. |
| Transition | Red | This transition was the last occurred event originator. |
| Transition | Blue | This transition is scheduled to occur in the future. The remaining time is displayed under the transition name (you control its visibility with the transition’s Show name property). |
-
How can we improve this article?
-