


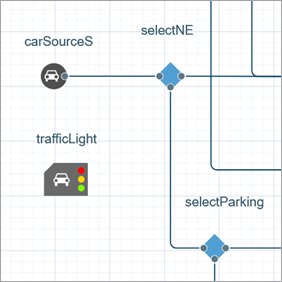
In this phase, we will create a controlled intersection by adding traffic lights to the flowchart.
To define the working mode for one or more traffic lights controlling vehicle flow on an intersection or a pedestrian crossing, we must use the  Traffic Light block from the Road Traffic Library.
Define the logic for traffic lights
-
Add a Traffic Light block from the Road Traffic Library to the flowchart. It does not have any ports and you do not need to connect it to any other flowchart blocks: just place it anywhere in the graphical editor.
-
Open the block properties. The key parameter here is Defines the mode for. It has three options:
- The Intersection stop lines option (selected by default). In our case, we should keep it selected, as the traffic lights created by this block will control traffic (stop/wait/go) on all lanes of the road adjacent to the intersection at once.
- The Intersection’s lane connectors option is used when the allowed traffic directions during a traffic light phase are not the same for different lanes of a single road.
- The Specified stop lines option is used when traffic lights created by this block control traffic at one or more pedestrian crossings, defined by the AnyLogic stop lines.
-
In the Intersection parameter, choose the name of the previously created intersection: intersection.
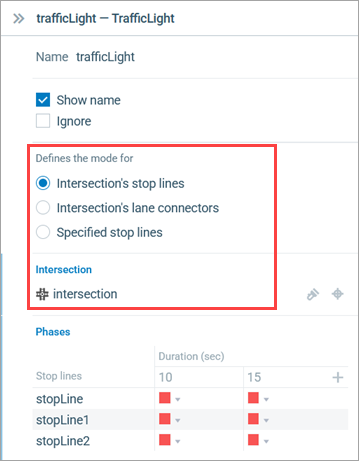
- Once you have specified the intersection in a traffic light’s properties, all its stop lines will be listed in the Phases table below. Here you define the red, green, and, optionally, yellow light phase duration for every stop line of the selected intersection.
-
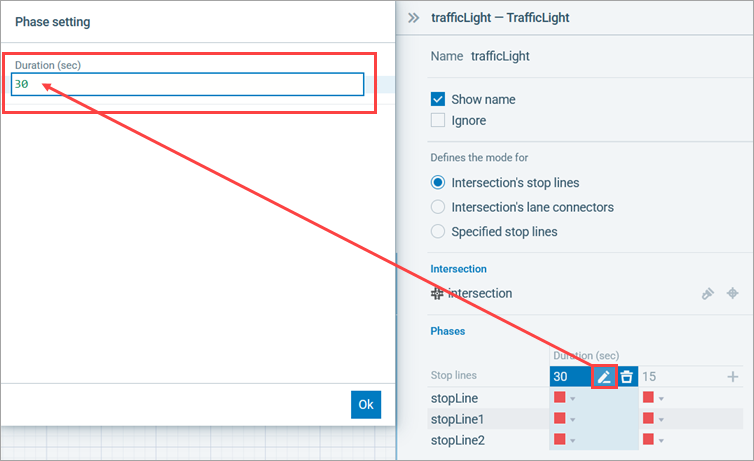
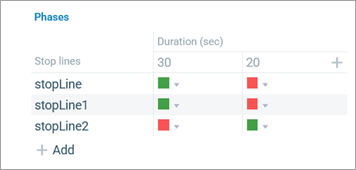
Let’s define the traffic light phases. We want a 30-second green light phase to allow traffic flow along Tapiolavägen. During this phase, the incoming traffic from Menninkäisentie is stopped. The green light phase should be followed by a 20 second red light phase for Tapiolavägen, which coincides with a green light for the turn from Menninkäisentie. The traffic light will continuously switch between the phases. By default, the Phases table contains two columns, one for each phase. We need to define the green and the red phases for each stop line. Start with configuring the first phase. Click the icon in the table header to edit the phase duration and set it to 30 seconds.
-
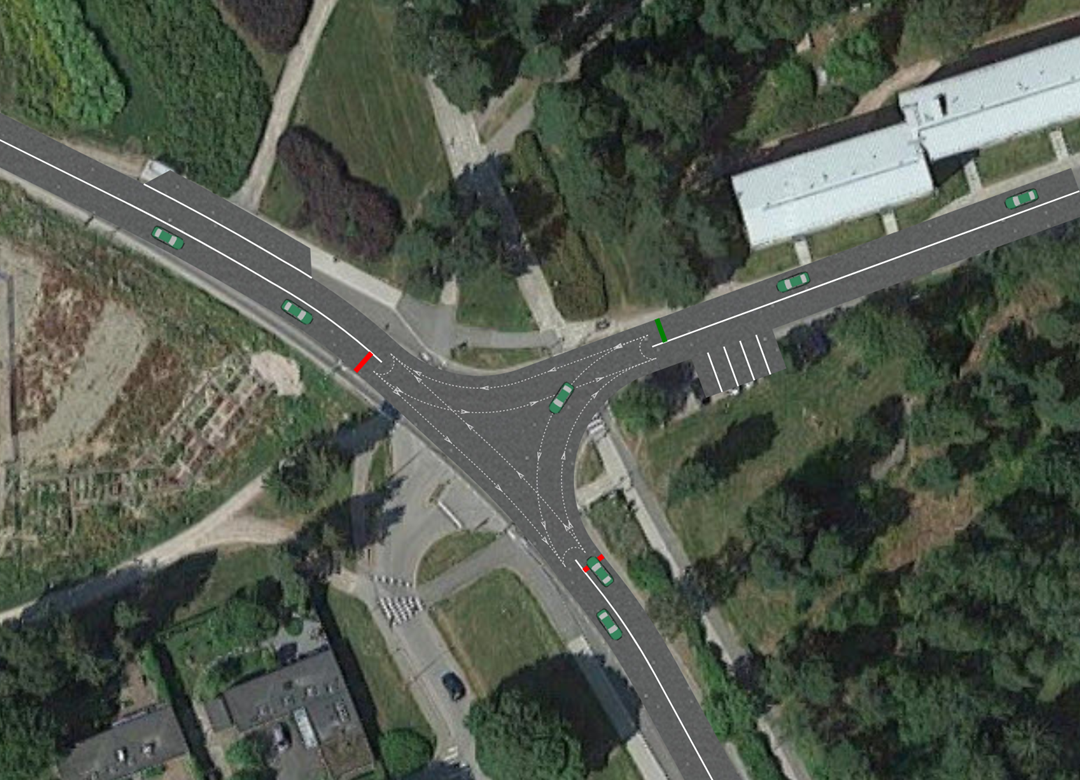
When a Phases table cell is selected, all the unrelated shapes in the graphical diagram are grayed out, while the relevant ones — stop lines or lane connectors, depending on the selected mode, — are highlighted, with the selected element looking brighter than others. This will help us select correct stop lines in the table.
For the first phase, we should set the Tapiolavägen stop lines (stopLine and stopLine1) to Green and leave the Menninkäisentie stop line (stopLine2) Red. To set the correct traffic light states for Tapiolavägen, click the corresponding cells and select Green in the drop-down list (see figure below).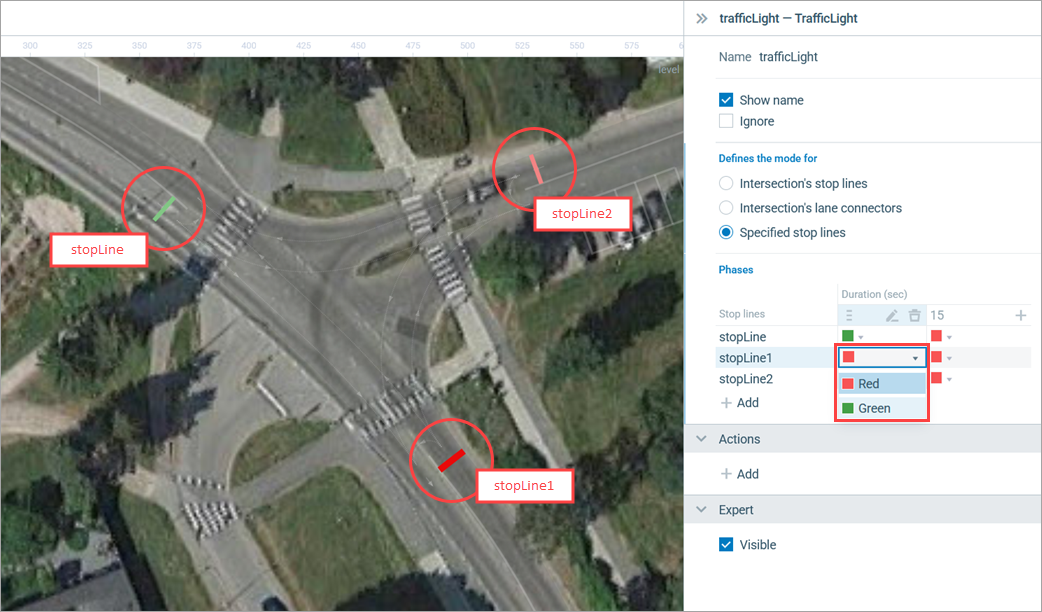
- Start editing the second phase by clicking the title of the second column and setting the duration of the phase to 20 seconds. Then click the stopLine2 cell and select Green from the drop-down list.
-
The complete Phases table should look like this:
Run the model. You will see the traffic light phases change, allowing traffic flow either on the main road, Tapiolavägen, or on the adjacent Menninkäisentie.
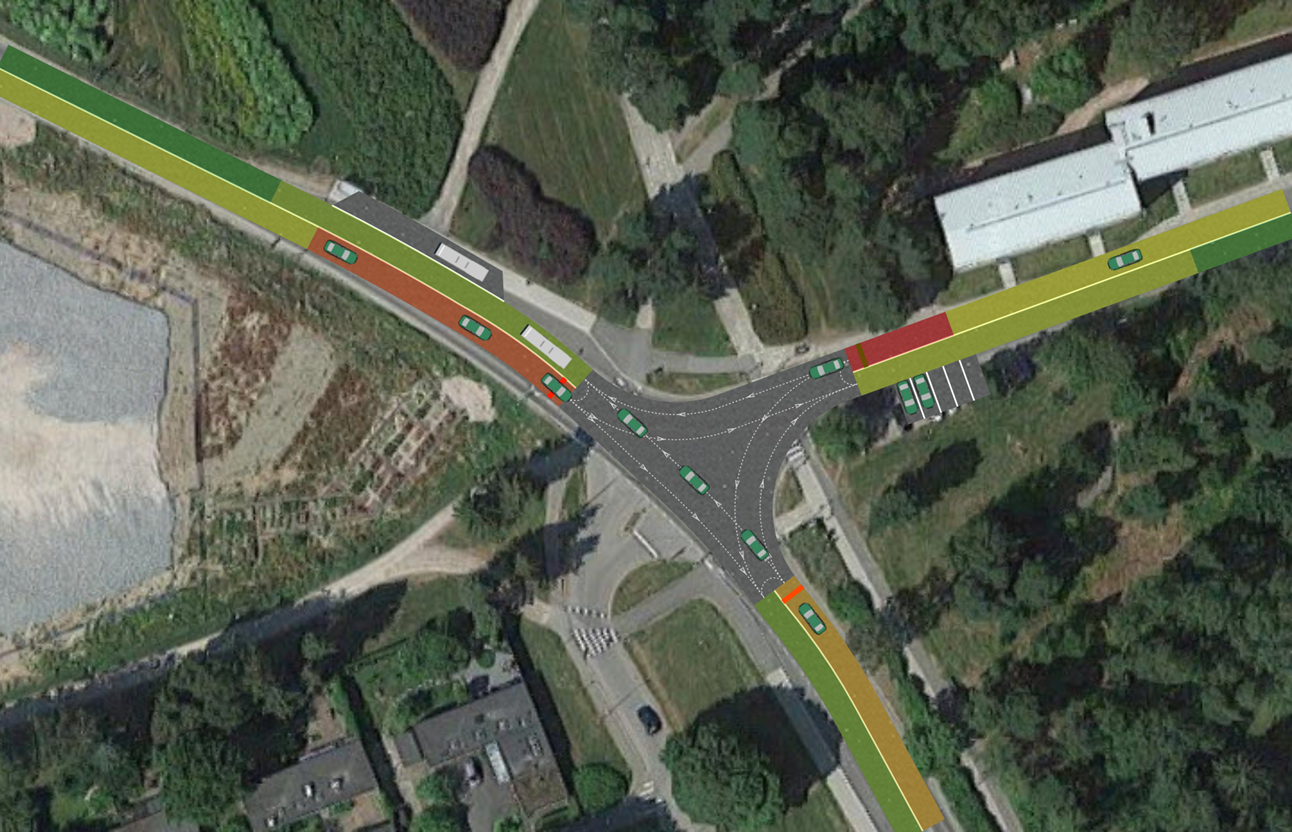
You might have noticed the traffic jams that occur sometimes in our simulation. In this next step, we are going to set up a car density map that will help us understand when does the road network get overloaded.
To show a car density map
-
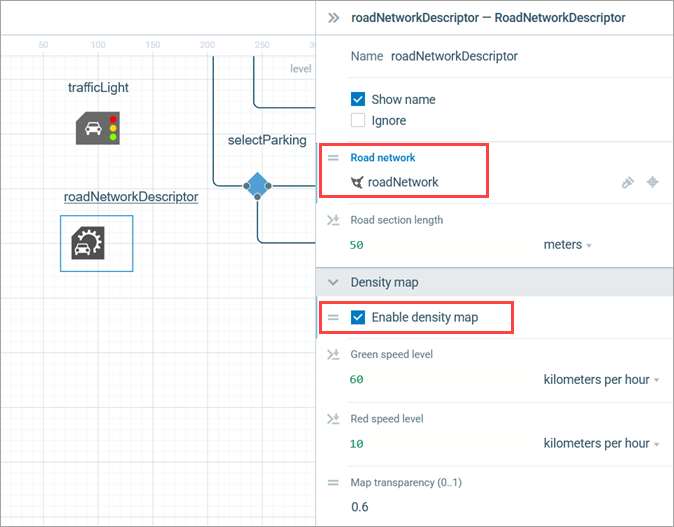
Add a
 Road Network Descriptor element to the graphical diagram from the Road Traffic Library palette. Just like with the traffic lights, there is also no need to connect this element to any other flowchart blocks.
-
Modify the element’s properties. Choose the name of the created road network (
 roadNetwork) from the Road network drop-down list.
-
Open the Density map section of the roadNetworkDescriptor properties and select the Enable density map checkbox.
Run the model and examine the current traffic situation on the intersection.
Now you can try altering the traffic light modes to find the most efficient phase settings. For instance, you may change the phase duration from 30 / 20 to 30 / 30 seconds.
This example is one of many demonstrating the practical application of the Road Traffic Library. Road traffic models are typically developed to evaluate and compare various traffic management strategies, such as the implementation of traffic signals, to model roads and intersections, identify congestion points, and assess the feasibility of modifying the number of lanes on specific segments of an existing road network. In addition to that, the AnyLogic Road Traffic Library supports both 2D and 3D animation, enabling enhanced visualization within broader simulation models. Using this library, you can incorporate elements such as shuttle buses and taxis into airport simulations, or semi-trucks into logistics center models, driving your animations to a new level of depth and realism.
Demo model: Road Traffic Tutorial - Phase 6 Open the model page in AnyLogic Cloud. There you can run the model or download it (by clicking Model source files). Demo model: Road Traffic Tutorial - Phase 6Open the model in your AnyLogic desktop installation.-
How can we improve this article?
-