


First, we will create a simple model simulating the way cars drive north along Tapiolavägen.
To create a new model
- Log in to AnyLogic Cloud at https://cloud.anylogic.com.
- Click the My models tab to open the page containing your models.
- Now click + New model to open the Create new model dialog box.
-
In the Create new model dialog box that appears, specify the name of the new model: Road Traffic Tutorial.
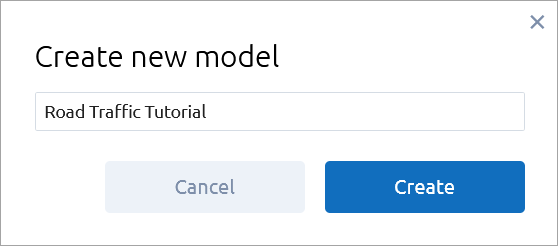
- Finally, click Create.
The new model already has one agent type called ![]() Main. Agents are the main building blocks in AnyLogic models. In our case, the Main agent will serve as the space where we will define the entire model logic: we will draw a road network and define the traffic flow using a flowchart.
Main. Agents are the main building blocks in AnyLogic models. In our case, the Main agent will serve as the space where we will define the entire model logic: we will draw a road network and define the traffic flow using a flowchart.
In the center of the workspace you will see the graphical editor. It shows the Main agent’s graphical diagram.
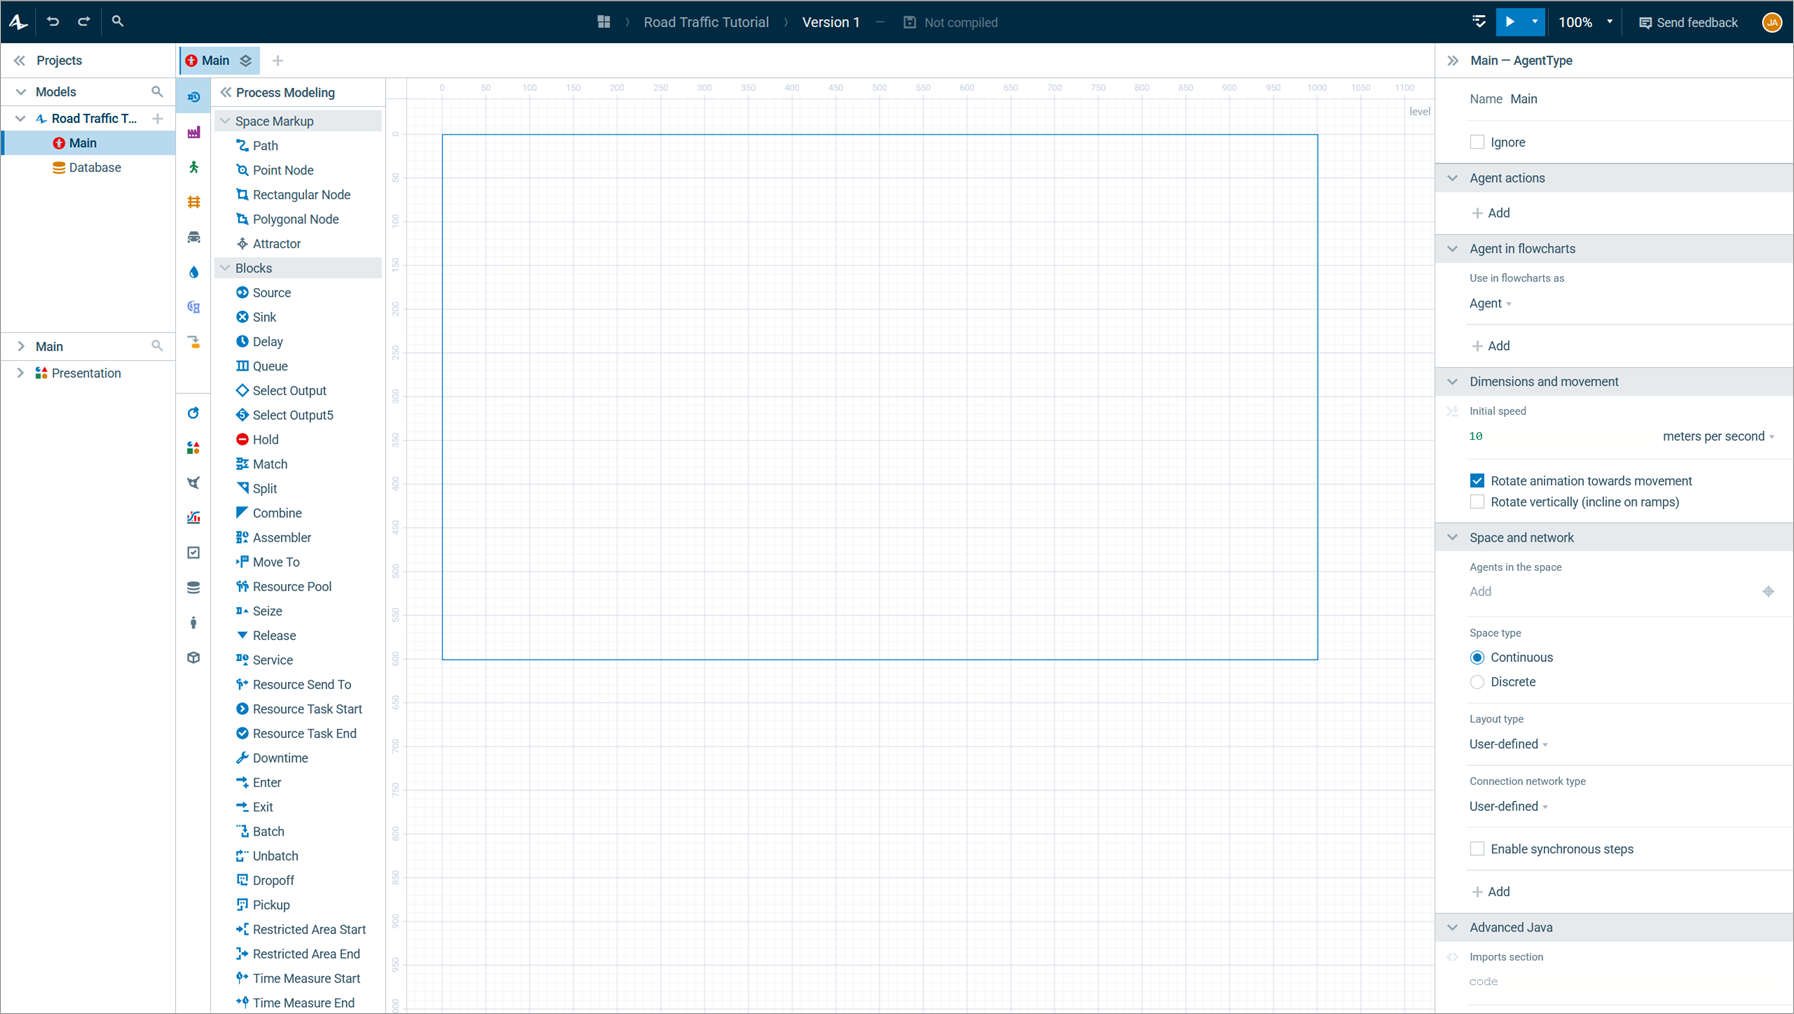
To the left of the graphical editor you can see the Project view and the Palette view sharing the same area. The Project view provides access to AnyLogic models currently opened in the workspace. The workspace tree provides easy navigation through the models. The Palette view contains all the graphical elements you can add to graphical diagrams simply by dragging. Model elements are grouped into palettes by category.
On the right side of the workspace you can see the Properties view. It is used to view and modify the properties of currently selected model elements. When you select something, for instance, in the Projects view or in the graphical editor, the Properties view displays the properties of the selection.
Now that we got acquainted with the user interface, we can start developing the model.
The typical scenario is the following:
- Place an image with the layout of your simulated space in the graphical editor.
- Draw roads on top of the layout.
- Define the traffic flow using the
 Road Traffic Library flowchart blocks.
Let’s build a simple model by following these steps.
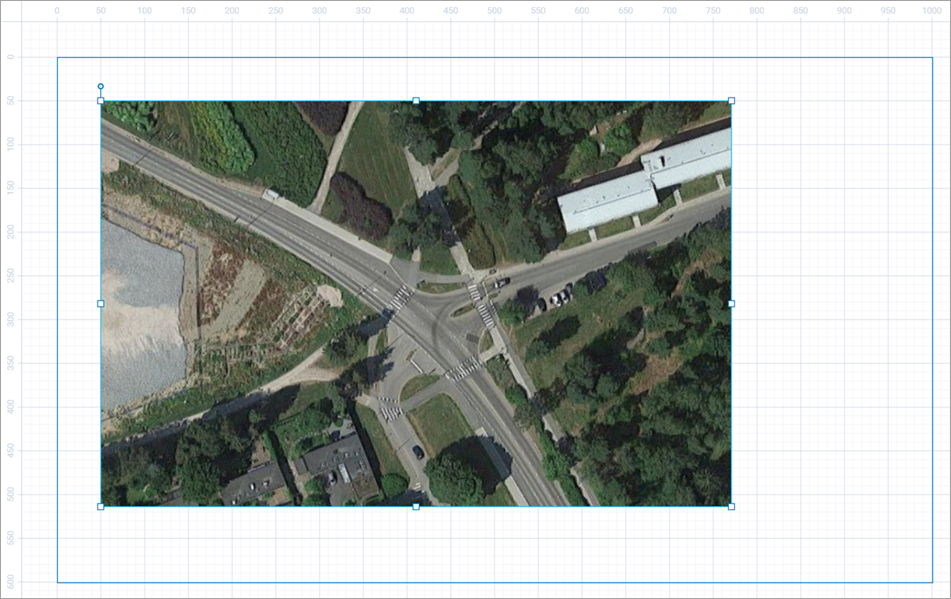
We will use the following image:
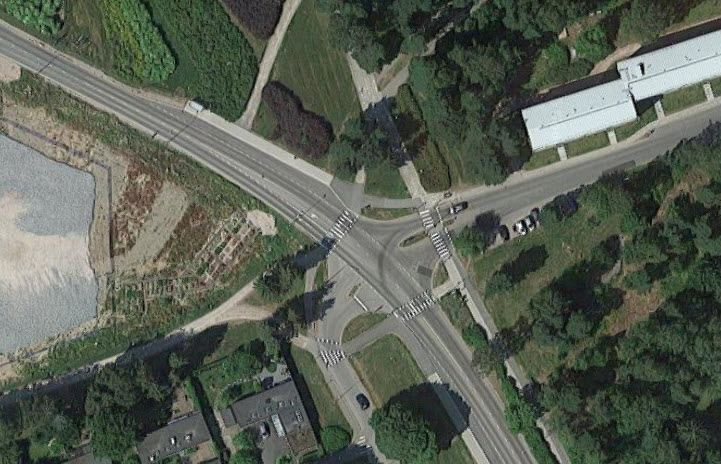
Save the layout image to your device
- Right-click the image above, click Save Image As… and select the location for the image file.
- Press Save.
Now we can add this image to our model’s graphical diagram.
Add the layout to the graphical diagram
-
First, find the Presentation palette in the Palette view. This palette contains shapes which you can use in your presentation. To open a palette, click on the corresponding icon in the vertical ribbon docked to the left side of the palette. You can toggle the expanded view with the names for all the palettes and elements by clicking . To return to the minimized view, click .
Select the Presentation palette to open it.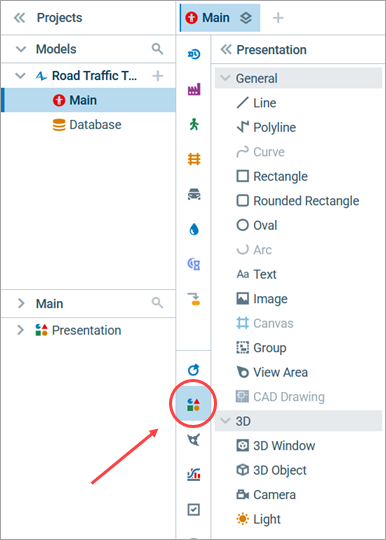
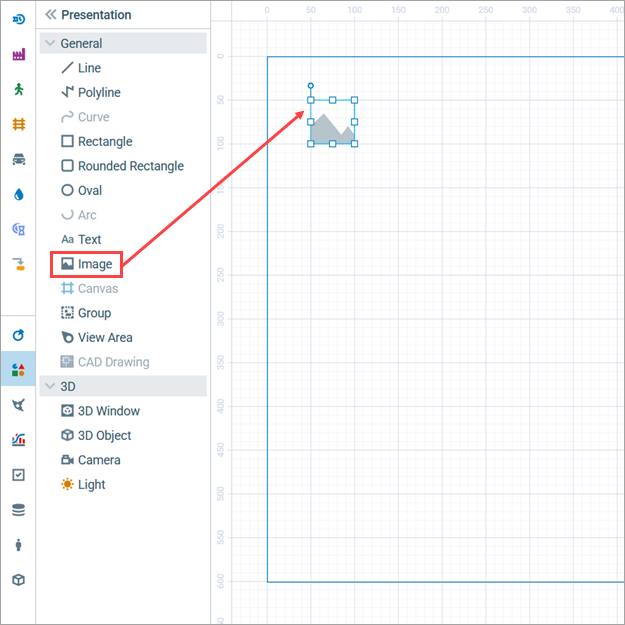
- Drag the
 Image element from the Presentation palette to the graphical diagram.
-
When you drop the element icon on the graphical diagram, the file browser opens automatically. Open the folder where you just saved the layout image, select the file, and then click Open in the dialog box. You will see the picture displayed in the graphical editor:
When defining road networks in AnyLogic, you can draw roads, intersections, and add other space markup elements, such as bus stops, stop lines or parking lots. We will start by drawing Tapiolavägen, placing it directly on top of the corresponding road on the picture.
-
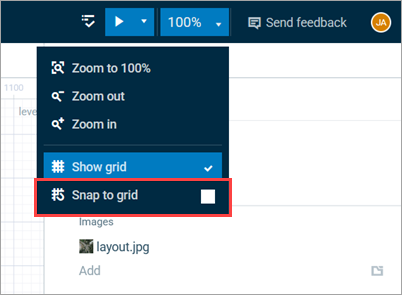
Before you start drawing, we advise you to switch off the grid alignment in the graphical editor. To do so, clear the Snap to grid box:
-
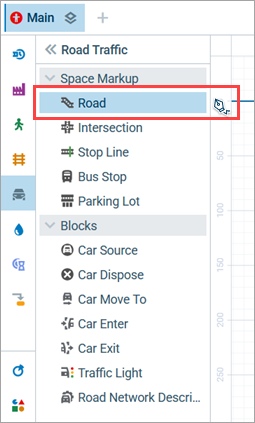
In the Palette view, switch to the Road Traffic Library:
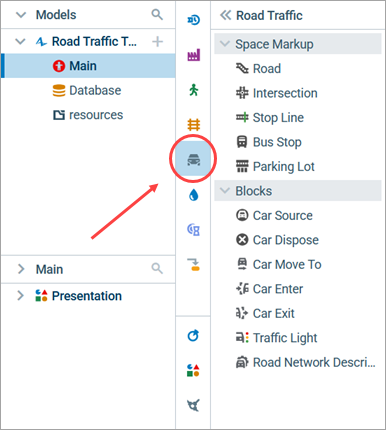
- Click the
 Road element in the Space Markup section of the Road Traffic Library palette. The icon of the element should turn into
  . It means that the drawing mode is activated and you can now draw the road point by point.
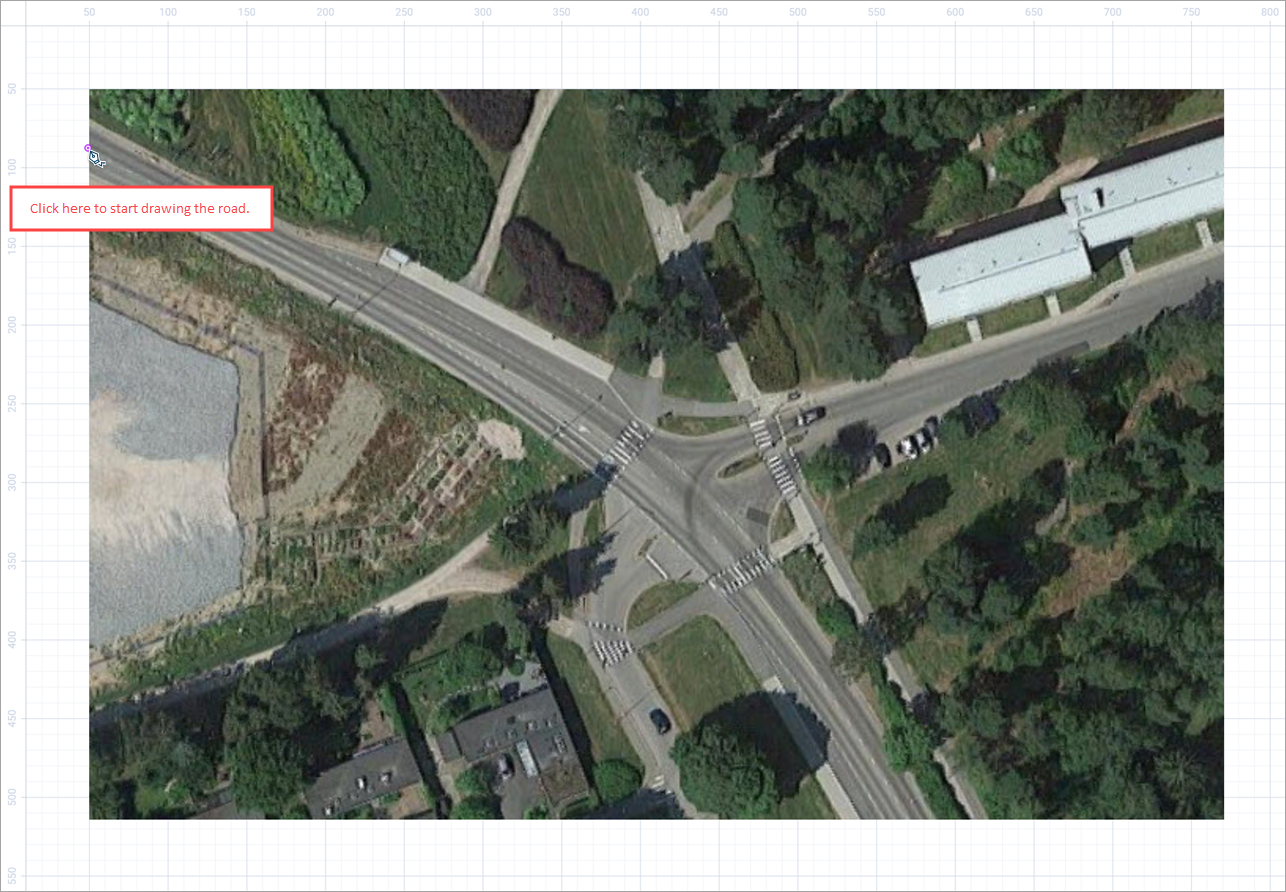
-
Click the layout image to set the starting point of the road like so.
-
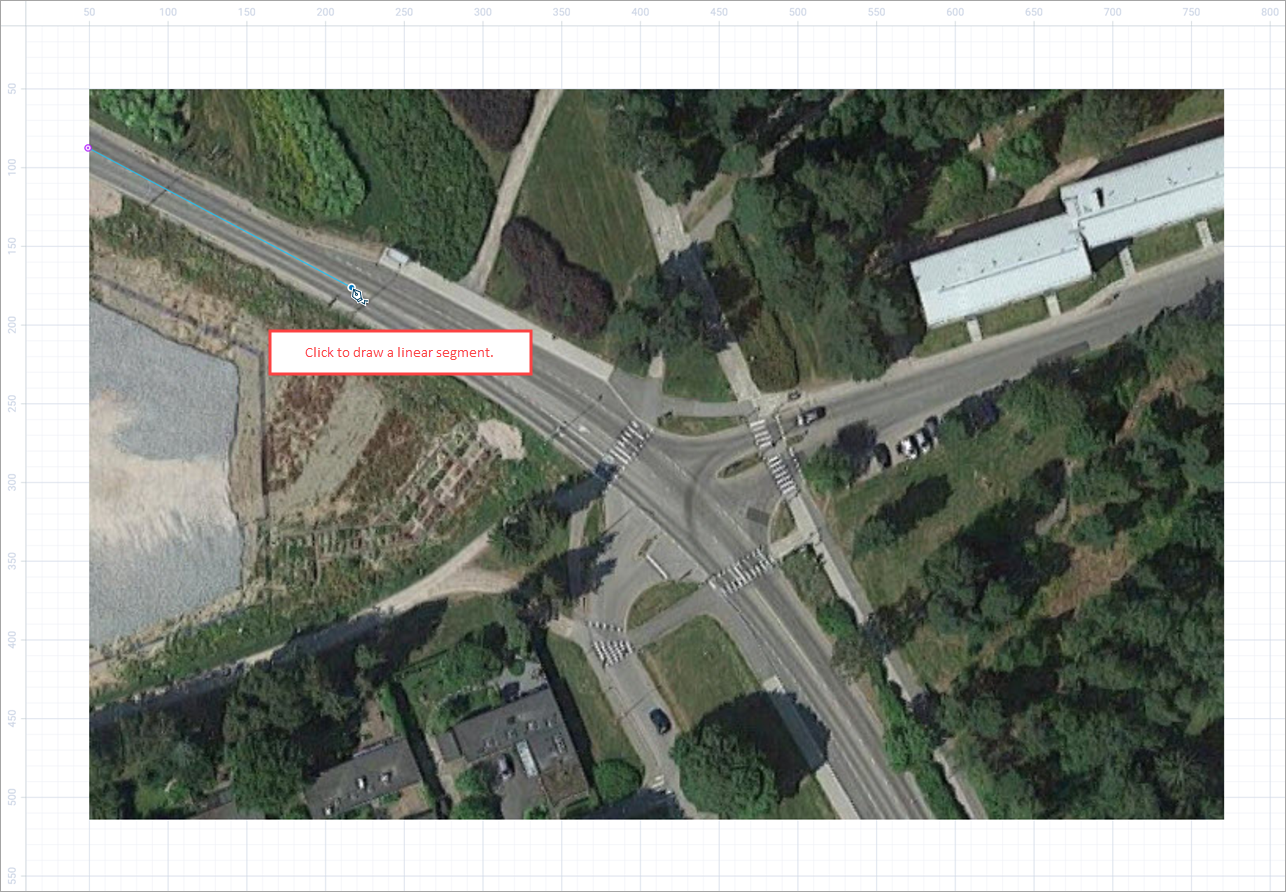
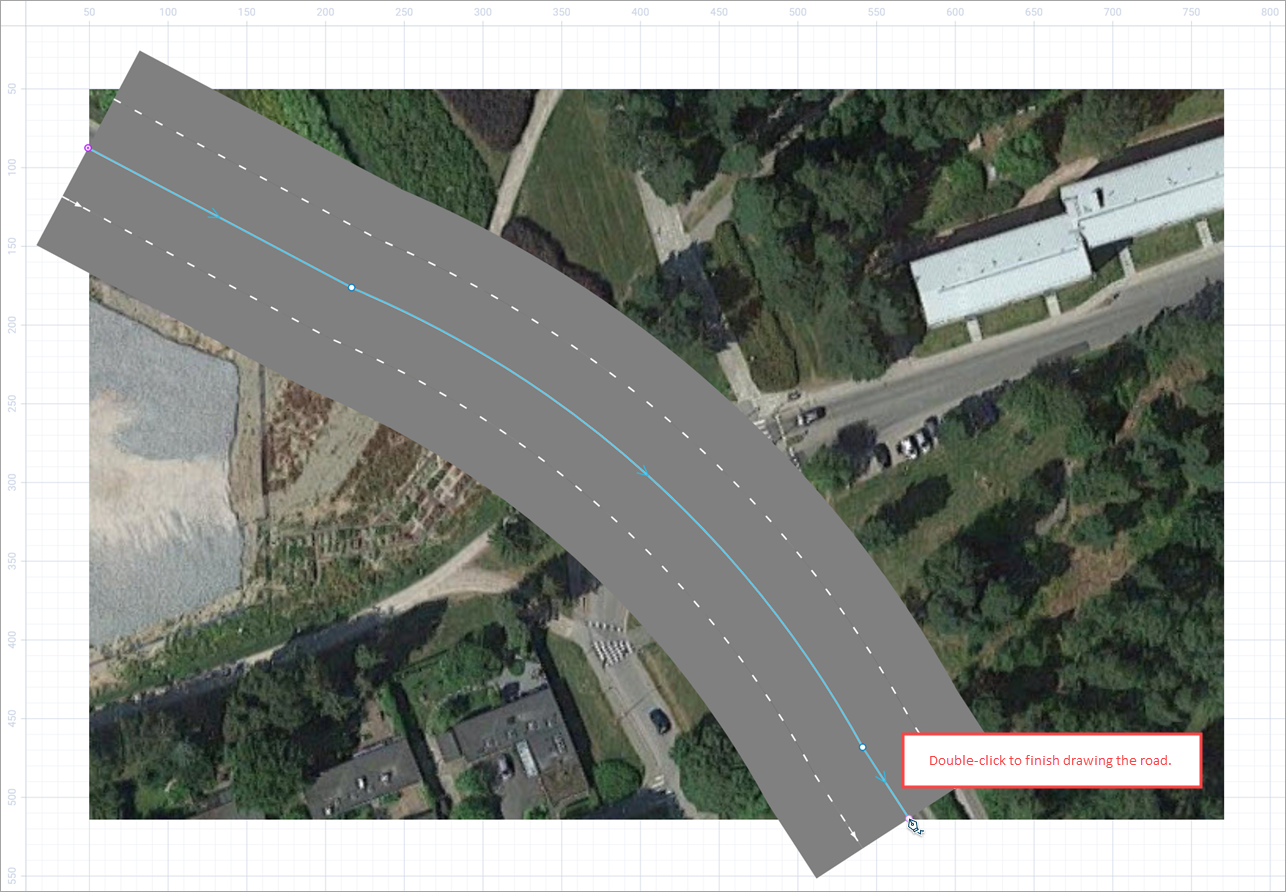
Continue drawing the road step by step. Our road starts straight. To complete a linear segment, click the place where you want to put its end point (see figure below).
-
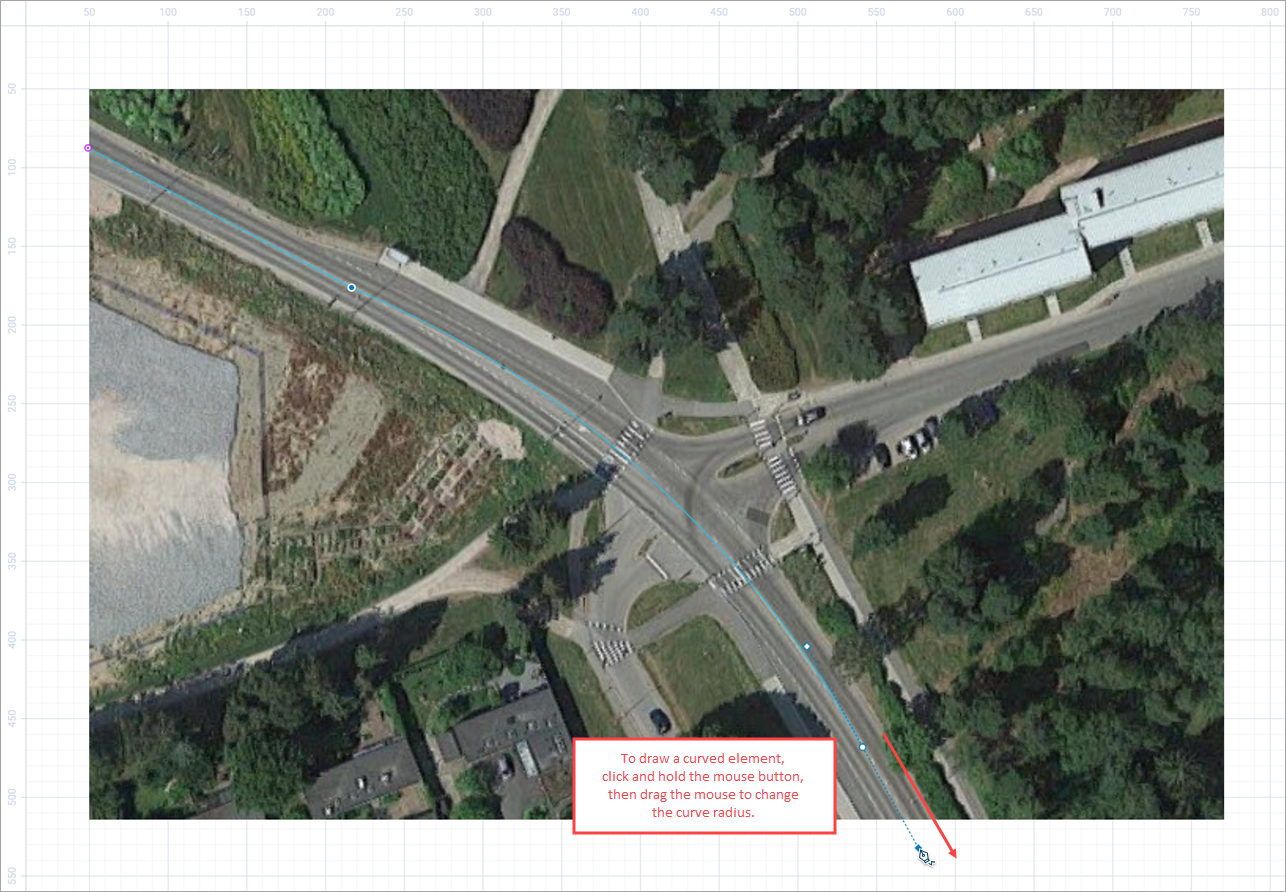
The next segment of our road is curved. To draw a curved segment, press the left mouse button at the road’s next turning point (at the beginning of the next linear segment) and, with the left mouse button being pressed, move the mouse until you get the required shape. Release the mouse button when you are finished adjusting the shape.
-
Set the final point of the road with a double-click.
-
Typical road models use a scale of 4 pixels per meter. Since this is not the default value, it is best to set the correct scale before continuing with the model.
- Locate the
 Scale element on the
  Main diagram. By default, it is placed above the coordinate origin, so you might need to scroll up a little.
-
Click to see the Scale element’s properties in the Properties view on the right.
-
Set the properties to the following:
Scale is: Specified explicitly
Scale: 4 pixels per meter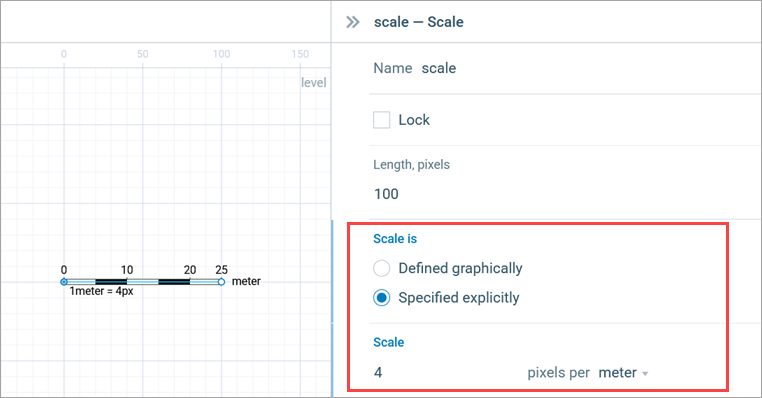
Eventually you will see the drawn road. It should look like the one in the figure below.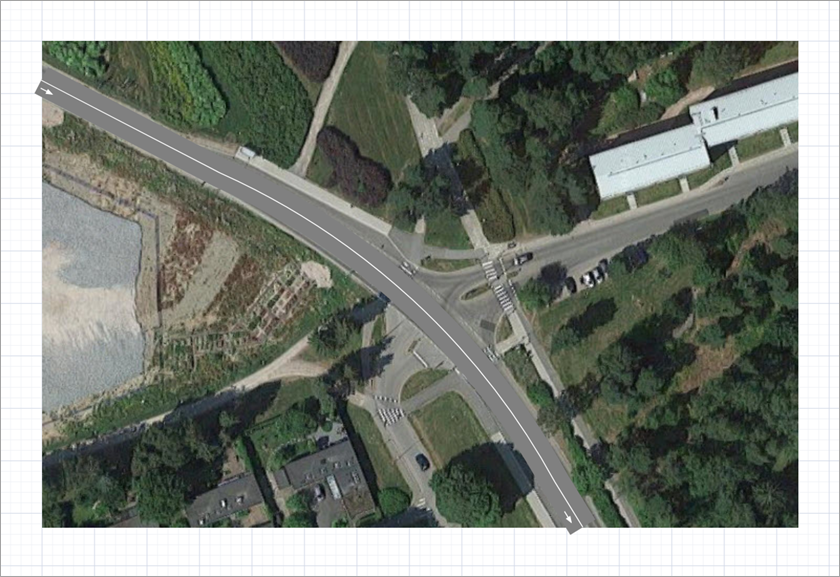
- Locate the
-
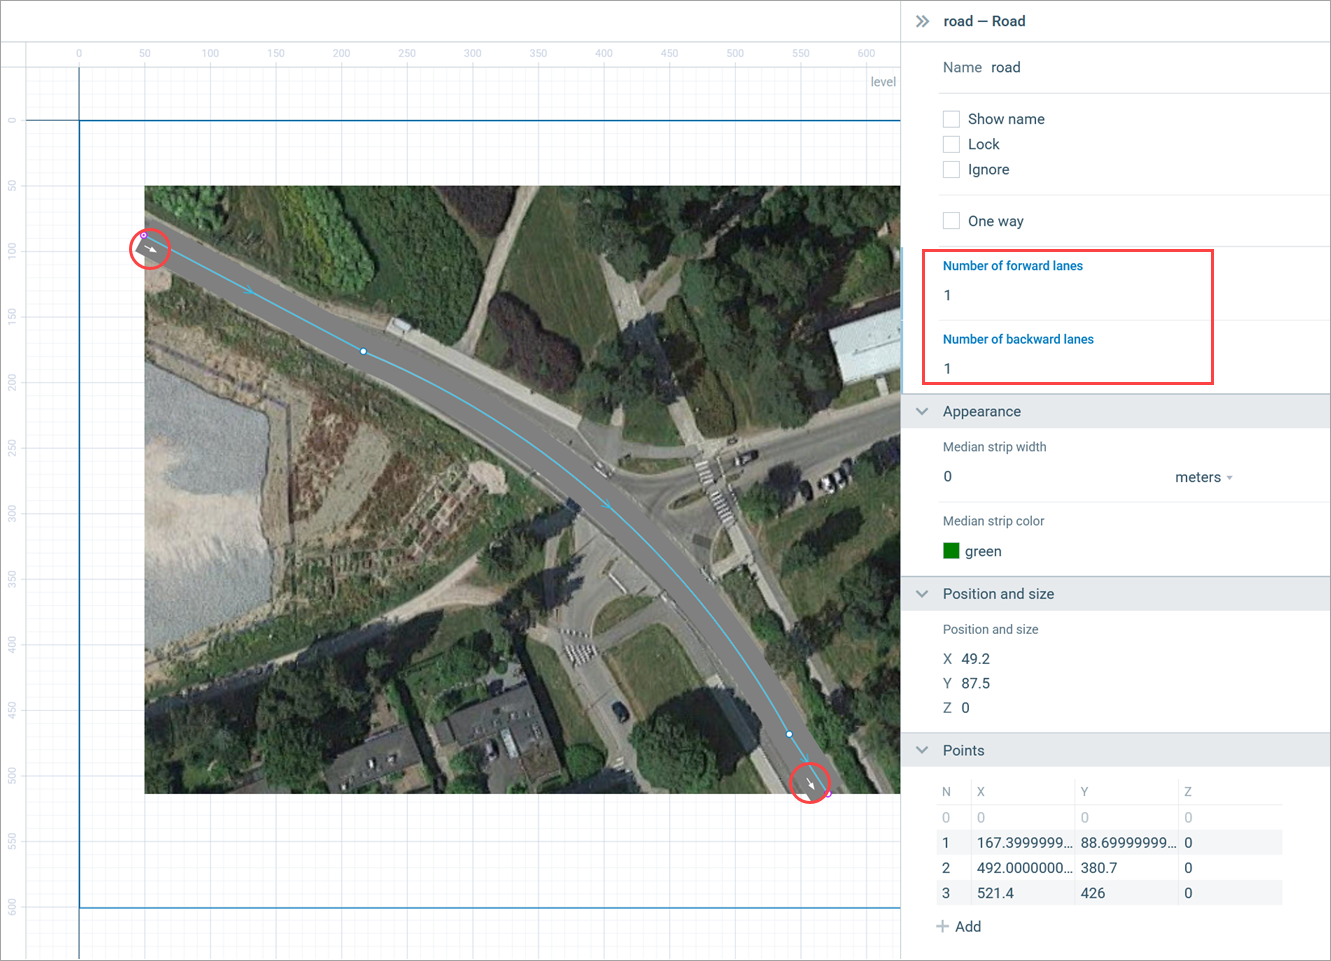
Customize the road attributes in the Properties view. By default, roads are drawn two-way with two lanes for each direction (forward lanes, with their direction marked by white arrows, and backward lanes). Our road, Tapiolavägen, has one forward and one backward lane, so you need to change both Number of forward lanes and Number of backward lanes to 1. The number of lanes in the graphical diagram will decrease automatically.
-
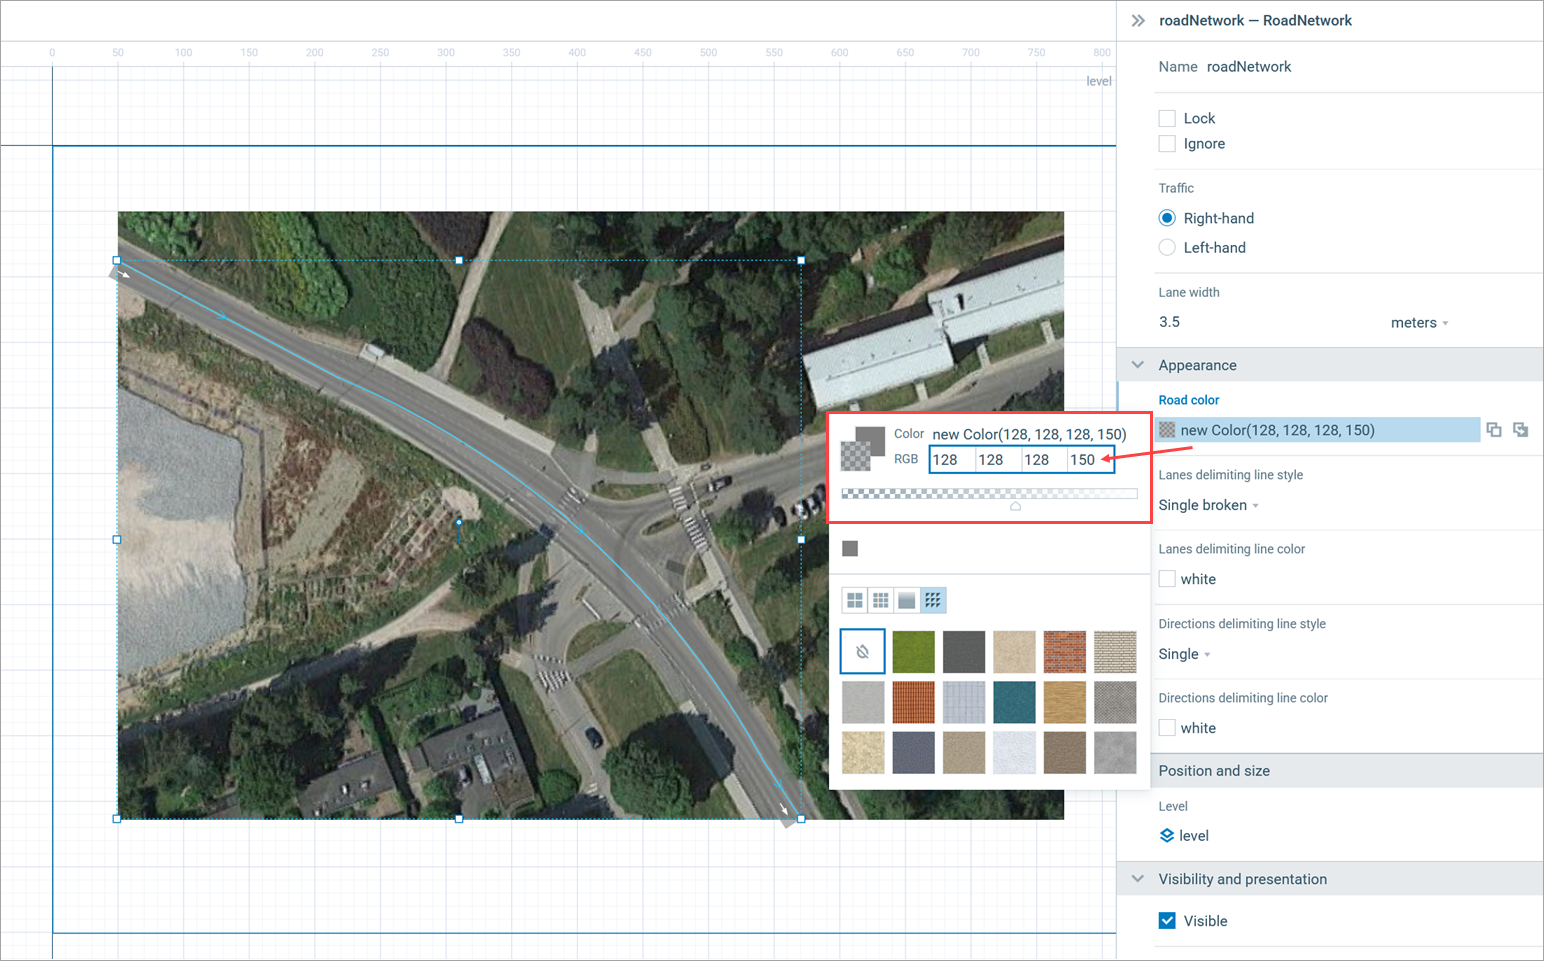
As you can see, the road is drawn opaque. You can make it semi-transparent to double-check whether the resulting road perfectly matches the road on the map. The transparency setting (as well as traffic direction and lane width) is defined not in the road properties, but in the properties of the road network this road belongs to.
Select the road network by single-clicking the road twice: the first click selects the road itself, the next one selects the road network. Having selected the road network, open the network’s Appearance properties. Click the Road color control and drag the transparency slider or reduce the Opacity in the fourth field of the RGB setting. Here we will set the opacity to 150.
- Now you can see if the drawn road matches the road on the map. To adjust your road, use already existing points or double-click anywhere on any segment to add new ones. You can learn more about drawing in AnyLogic 9 on the Drawing help page.
Now we will define the traffic flow with a flowchart built with the Road Traffic Library blocks. Each block here will define a certain operation that will be performed when cars pass through it.
In AnyLogic, you create flowcharts by adding blocks from a palette onto the graphical diagram, connecting blocks together and adjusting the parameters of the blocks.
Create the process flowchart
-
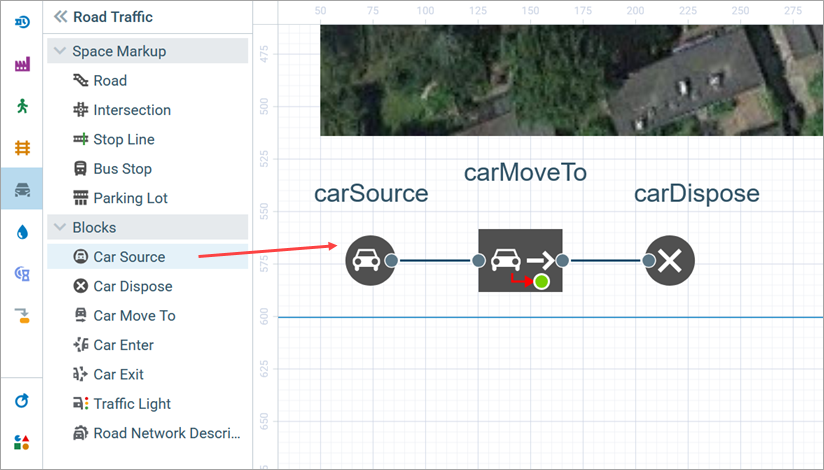
Open the Road Traffic Library palette. Add Road Traffic Library blocks to the diagram and connect them as shown in the figure below. To add a flowchart block to the diagram, drag the required element from the palette into the graphical editor.
Let’s say a couple of words about these flowchart blocks.
- The
 Car Source block generates cars. It is usually used as a starting point of the car flowchart.
 - The
 Car Move To block simulates and redirects traffic to a specified destination.
 - The
 Car Dispose block indicates the end of the flowchart and discards incoming cars from the model.
You can refer to the Road Traffic Library guide for detailed information about the library’s blocks.
Configure the flowchart blocks
To modify the properties of a model element, click it in the graphical diagram and access the attributes of the selected element in the Properties view.
-
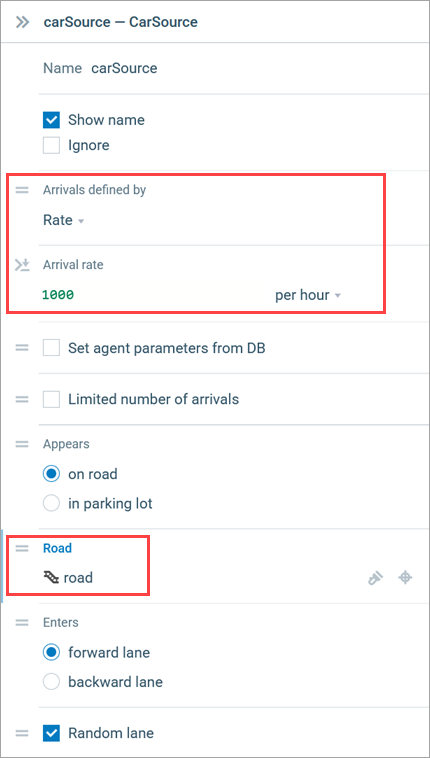
Select the carSource block. In the Properties view, specify how often cars arrive. In the Road drop-down list, select road, it should have the name of the road we have previously drawn. This way we tell this carSource block to place generated cars on this particular road.
-
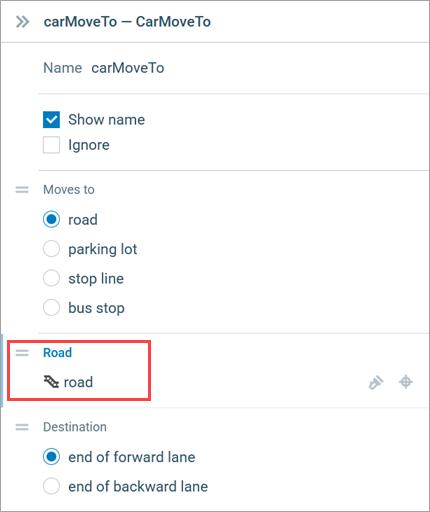
Modify the properties of the carMoveTo block. Leave the default Moves to: road setting and again select road in the Road drop-down list. This block will simulate how cars drive along the specified road, up to the end of the road’s forward lane (it is set by the block’s Destination property; the forward direction is marked on the respective lanes with a white arrow).
- Leave the default properties for the carDispose block.
Now we are ready to run the model.
First, locate the Build and Play buttons on the toolbar at the top.
Next to there is a drop-down menu that gives you access to all of your experiments and model versions in the Scenario manager.
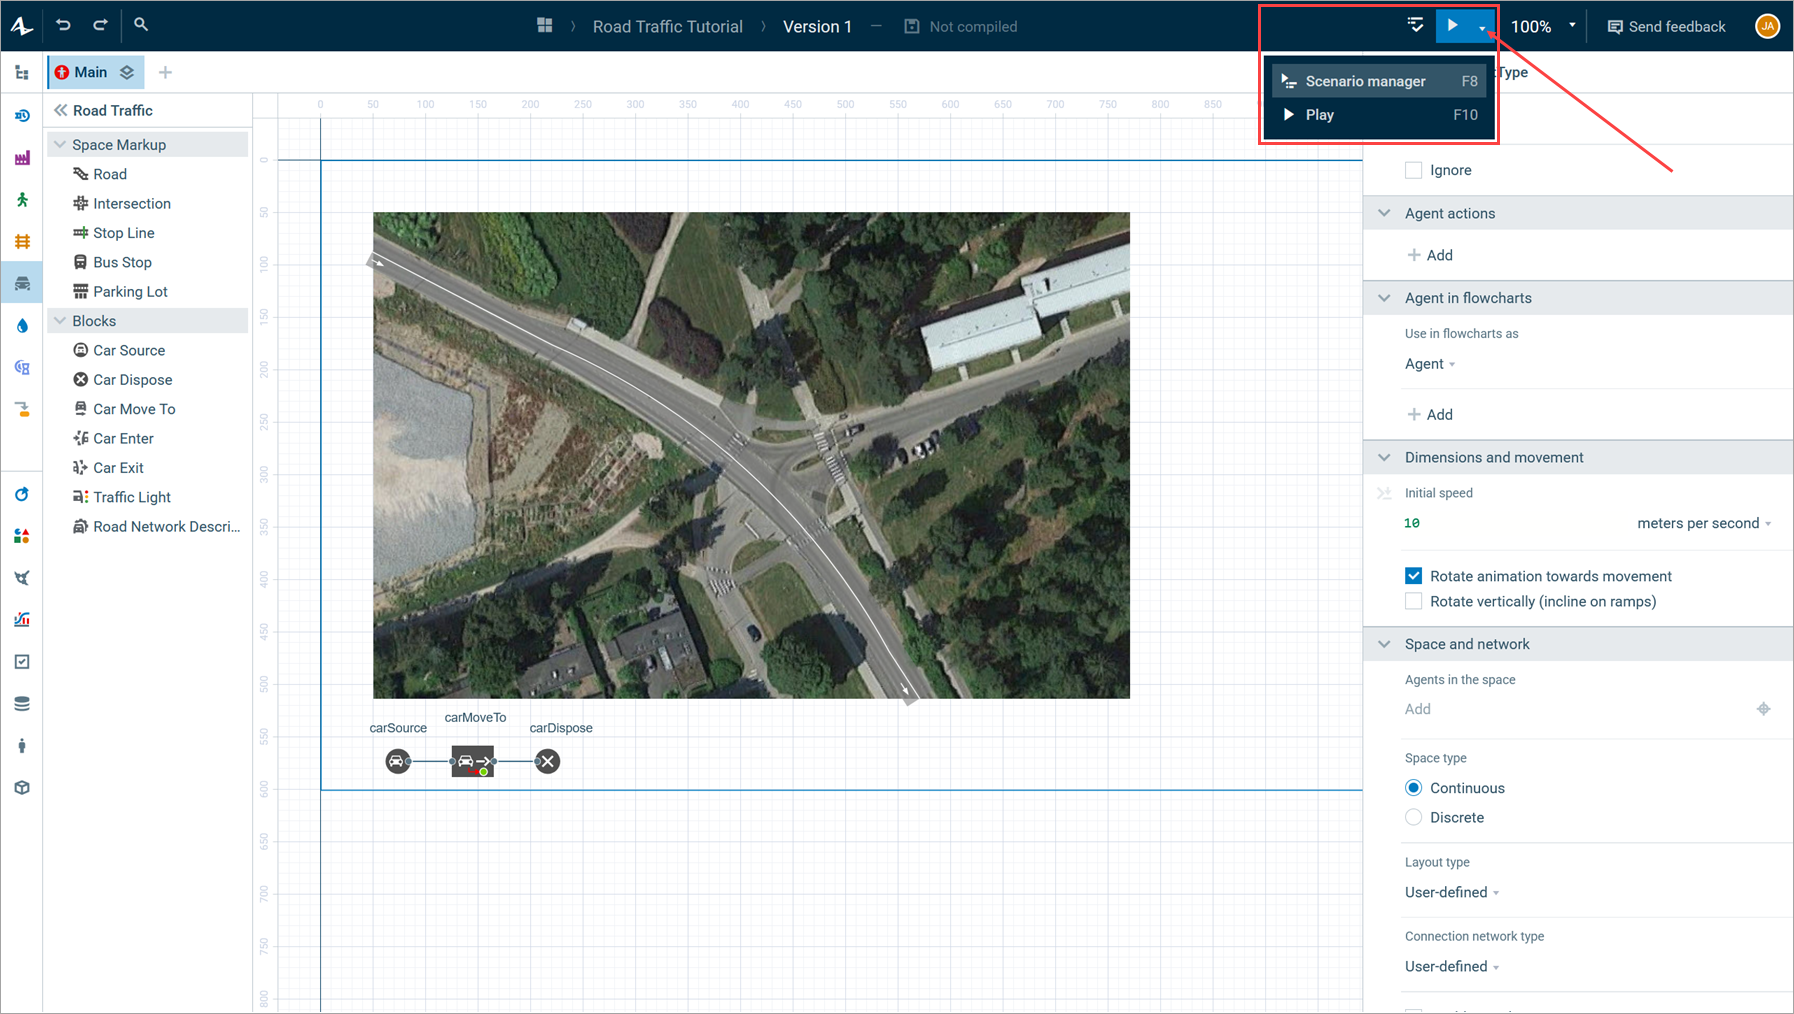
Build your model by clicking Build. If your model contains errors, the building will fail and the Errors view will appear, listing all the errors found in your model. Double-click an error in the list to open its location and fix it.
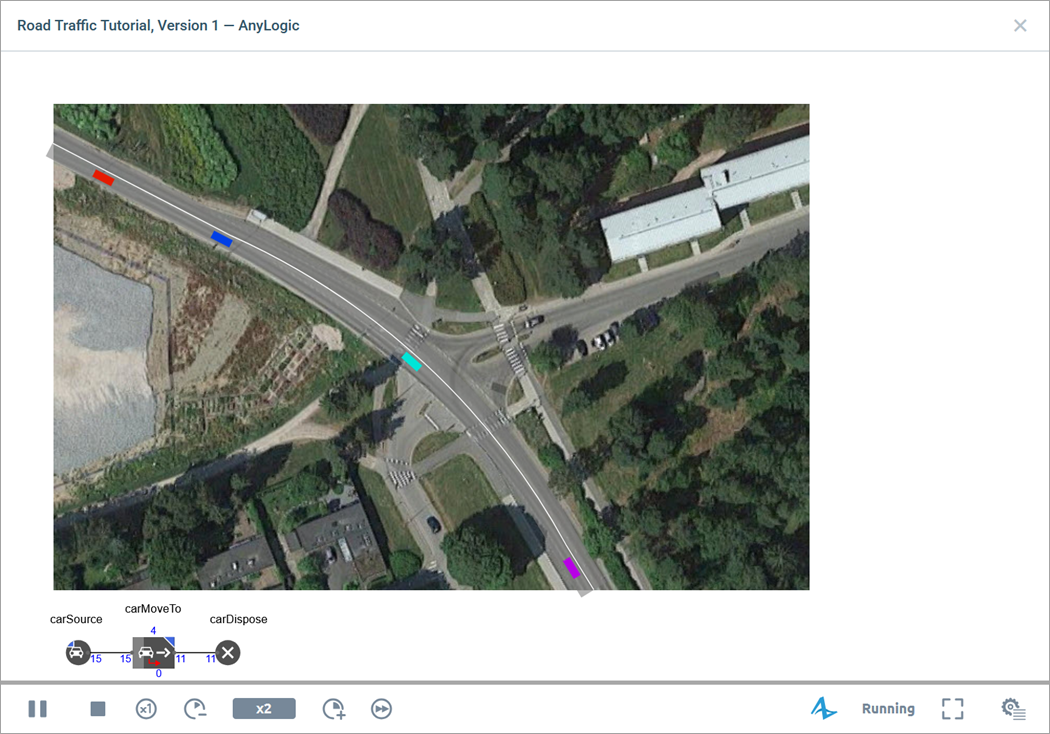
After the model is successfully built, you can play the animation. This brings the current model up to date automatically.
On starting the model, you will see the model window. It displays the presentation of the top-level agent type (by default, it’s Main). Observe the process dynamics. You will see a 2D animation with cars moving over the layout image. If needed, adjust the execution speed using  Slow down and
  Speed up controls.
You will also see the animated flowchart. Each model created with the Road Traffic Library instantly acquires an animated flowchart showing the number of cars which passed through the block, and the number of cars that is currently inside this flowchart block.
-
How can we improve this article?
-