


First, we will create the simplest queuing model simulating how customers are serviced at the ATM.
Create a new model
- Log in to AnyLogic Cloud at https://cloud.anylogic.com.
- Click the My models tab to open the page containing your models.
- Now click + New model to open the Create new model dialog box.
-
In the Create new model dialog box that appears, specify the name of the new model: Bank Office.
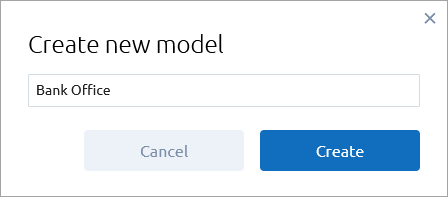
- Finally, click Create.
A new model is created. It already has one agent type called ![]() Main. Agents are the main building blocks of AnyLogic model. In our case
Main. Agents are the main building blocks of AnyLogic model. In our case ![]() Main agent will serve as the place where we will define all the logic of the model: here we will put the process flowchart, and define some simple animation.
Main agent will serve as the place where we will define all the logic of the model: here we will put the process flowchart, and define some simple animation.
In the center of the workspace you will see the graphical editor. It shows the diagram of the ![]() Main agent type.
Main agent type.
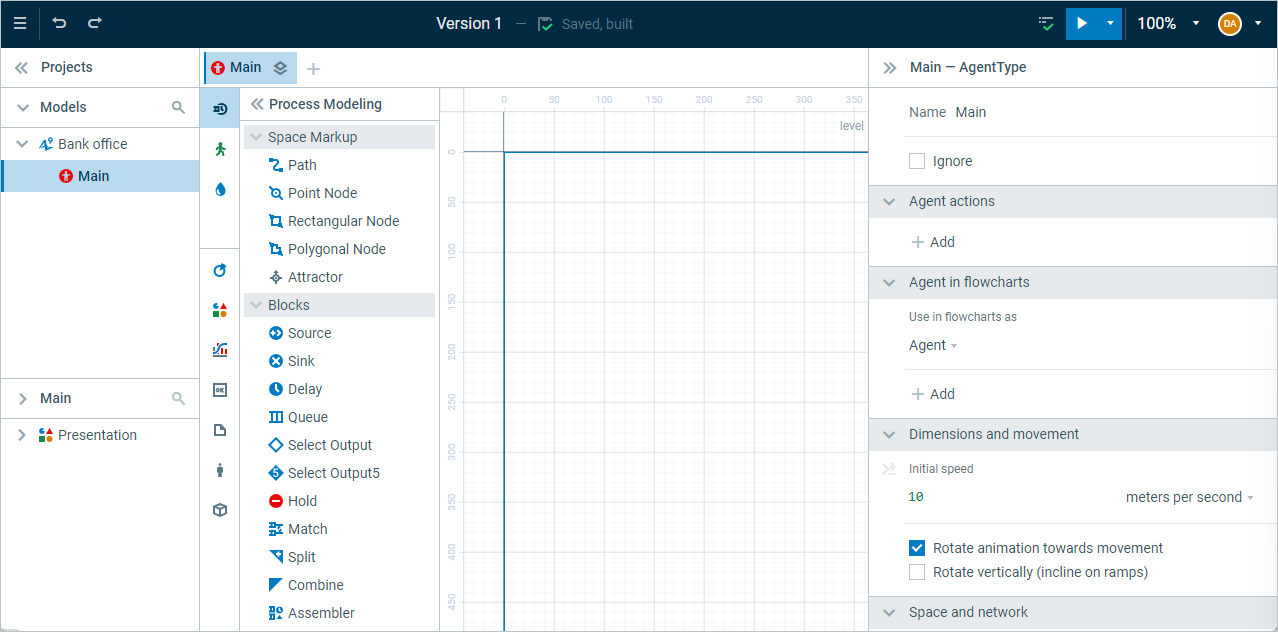
To the left of the graphical editor you can see the ![]() Projects view and the Palette view sharing the same area. The
Projects view and the Palette view sharing the same area. The ![]() Projects view provides access to AnyLogic models currently opened in the workspace. The workspace tree provides easy navigation throughout the models. The Palette view contains all graphical elements you can add onto the graphical editor of your agent just by dragging. Model elements are organized in palettes by category.
Projects view provides access to AnyLogic models currently opened in the workspace. The workspace tree provides easy navigation throughout the models. The Palette view contains all graphical elements you can add onto the graphical editor of your agent just by dragging. Model elements are organized in palettes by category.
On the right side of the workspace you can see the Properties view. It is used to view and modify the properties of a currently selected model element(s). When you select something — e.g., in the ![]() Projects view or in the graphical editor — the Properties view displays the properties of the selection.
Projects view or in the graphical editor — the Properties view displays the properties of the selection.
Now we can start developing the model.
Now we will define the process with a flowchart composed from the  Process Modeling Library blocks.
Each block here defines some operation that will be performed with agents passing through this block.
In AnyLogic you create flowcharts by adding the blocks from the library palette to the graphical diagram, connecting blocks together and tuning the parameters of the blocks.
Create the model flowchart
- Select the
 Bank Office model in the
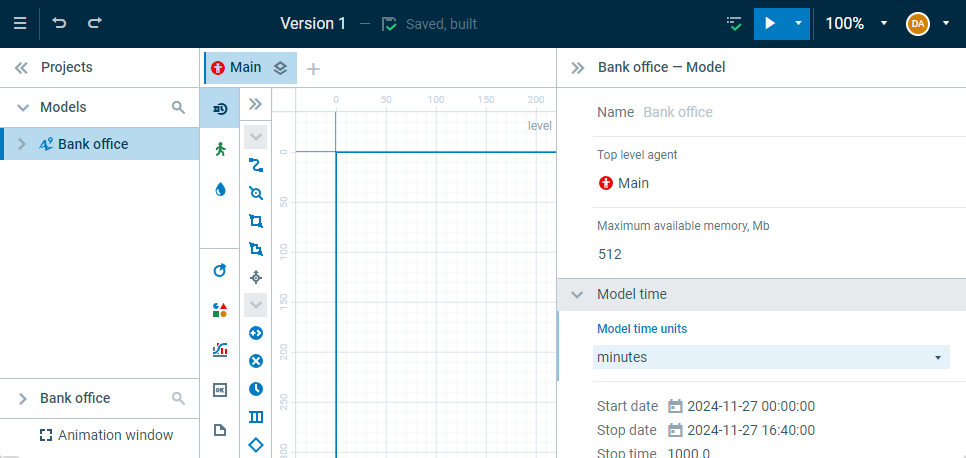
  Projects view. In the Model time section of its properties, change the model time units to minutes.
 -
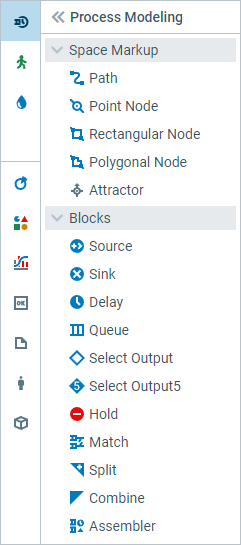
After you create the model, AnyLogic will switch to the Process Modeling Library palette:
-
Add Process Modeling Library blocks on the diagram and connect them as shown in the figure below. To add a flowchart block on the diagram, drag the required element from the palette into the graphical editor.
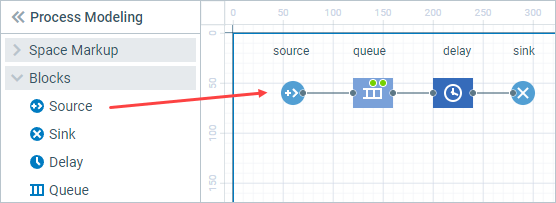
Our flowchart describes the simplest queuing system, consisting of a source of agents, a delay, a queue before this delay, and the final sink block.
We shall clarify what these flowchart blocks are for.
 Source block generates agents. It is usually used as a starting point of the process flow. In our example, it models customer arrival.
 Queue block models queues. In this model it simulates a queue of customers waiting for the moment they can start accessing ATM services.
 Delay here simulates the delay associated with the service at ATM.
 Sink block indicates the end of the flowchart and destroys the incoming agents.
See the Process Modeling Library blocks for a list of all Process Modeling Library blocks with short descriptions and links to individual detailed articles on every block.
Configure the flowchart blocks
To modify the properties of a model element, first select it by clicking on it in the graphical editor or in the ![]() Projects view. This opens the Properties view for this element.
Projects view. This opens the Properties view for this element.
-
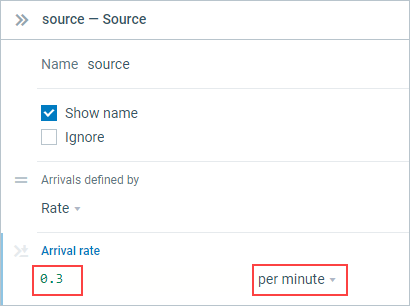
Select the source block. In the Properties view specify how often customers arrive by setting the Arrival rate to 0.3 per minute.
-
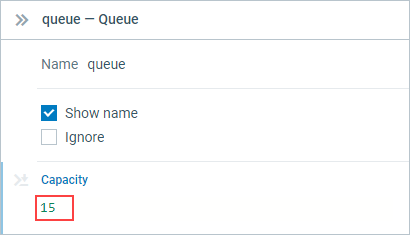
Modify the properties of the queue block. Set the Capacity to 15 agents. At most 15 customers will wait in a queue.
-
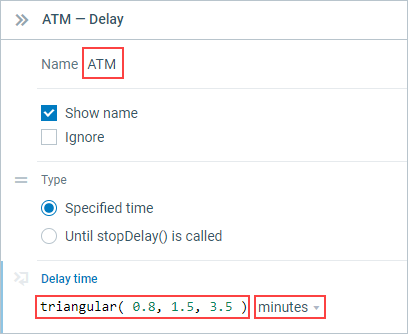
Rename the delay block to ATM.
-
Assume that processing time inside ATM is triangularly distributed with mean value of 1.5, min of 0.8 and max value of 3.5 minutes. Change Delay time as shown in the figure below and change time units to minutes.
We have finished modeling the simplest queuing system and we are ready to run the resulting model. The model is built automatically.
Start the model
-
Click the
 Play button on the toolbar, or
Press F10 on your keyboard.
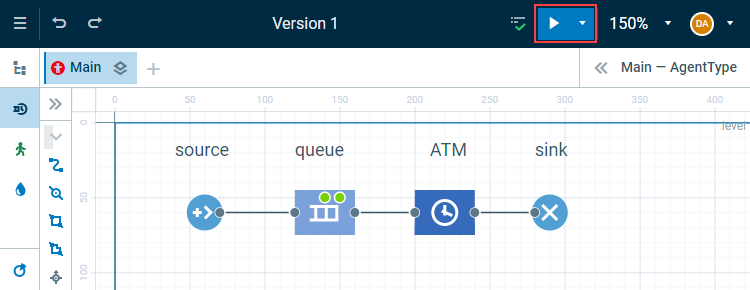
Having started the model, you will see the model window. It displays the presentation of the top-level agent type (by default, it is ![]() Main).
Main).
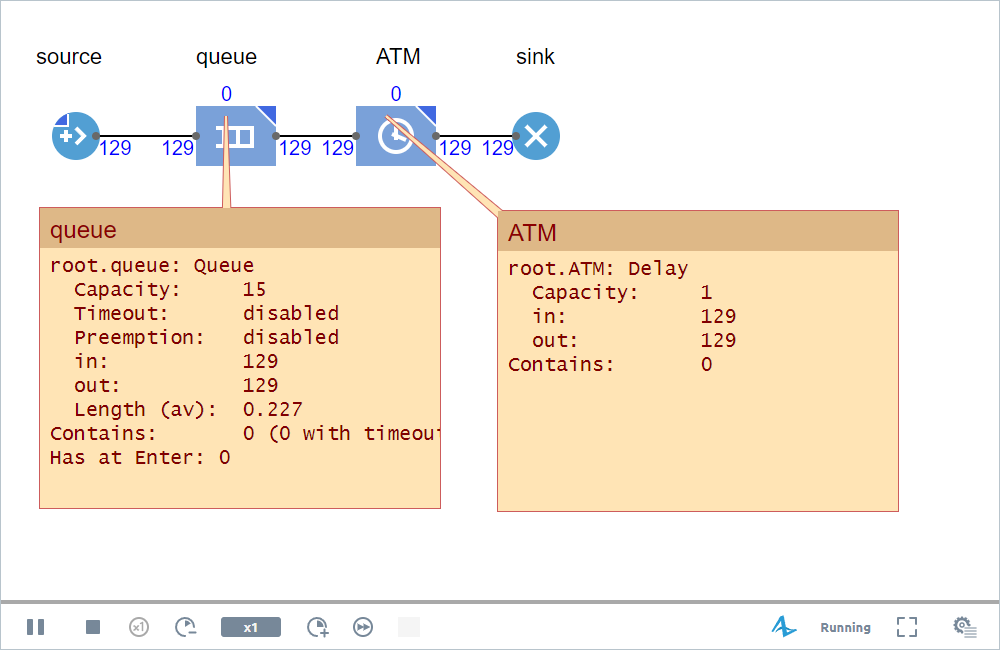
The model will launch immediately. You will see animated flowchart. Each model created with Process Modeling Library instantly has animated flowchart where you can see detailed current block status, for example queue size, number of agents left and so on — completely visualized!
If needed, adjust the execution speed to your needs using Slow down  and Speed up
  buttons in the control panel.
You can inspect flowchart blocks to get the detailed information on their current state. Click on the block to open its inspect window. Inspect window shows statistics of the block, e.g. Queue block’s inspect shows the queue capacity, the number of agents passed through either port of the block and also whether the timeout option is enabled for this queue. Contains string displays the number of agents currently being in the block along with IDs of these agents.
-
How can we improve this article?
-