|
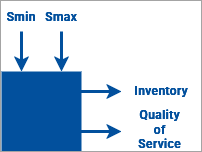
It looks like the model now fully reflects the system (the supply chain), but we are not ready to solve the problem. The model requires the following metrics:
We also need to be able to control the (s,S) parameters from outside the model. |
|
The agent population provides means to gather statistics out of box.
To create a statistics pool
-
Switch to the
Main agent type.
- Select the oilChangeStations population.
-
In the Statistics section of the Properties view, click Add. This will add a statistics collection element for the entire population.

-
Set up the statistics element:
Name: nOutOfOil
Type: Count: Condition: item.tank.amount() <= 0
Here, item refers to the population item, that is, an oil change station. The rest is simple: we count the number of stations where the amount of oil is less than or equal to 0. Adding such a statistic means adding an nOutOfOil() function that returns the corresponding number. No statistics will be collected unless you call this function somewhere.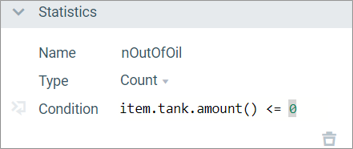
- Staying in the Main agent, select the Retailer stock chart we have created earlier. Press Ctrl, then drag and drop the chart on the diagram to create a copy.
-
Set up the properties of the data item for this new chart:
Title: Stations out of oil
Value: oilChangeStations.nOutOfOil() — with this, the plot will call the statistics function and update itself.
Style: Color: red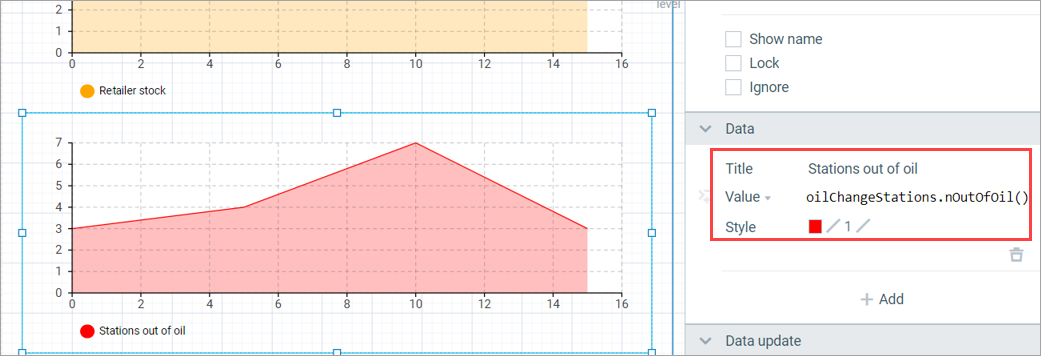
To adjust the values of parameters, use the elements of the 
To configure the controls
-
Switch to the
Retailer agent type. Select the Smin and Smax parameters and copy them using the context menu.
-
Switch to the
Main agent type. Paste the parameters onto the graphical diagram.
-
Select the retailer presentation on the Main agent (the image) and in the properties set its parameters to Smax and Smin.
This will propagate the parameters to Main, the top level of the model.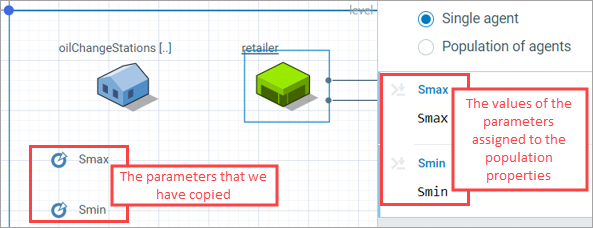
-
From the
Controls palette, add two
Sliders and connect one to Smax and the other to Smin.
Set the range of both sliders to 0..500.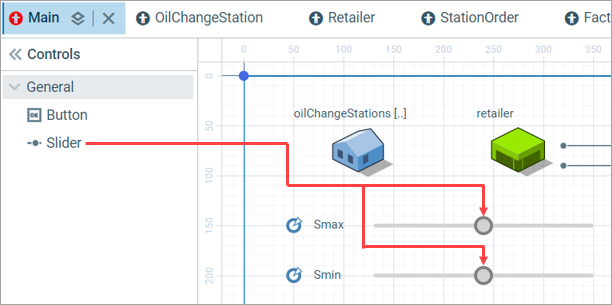
Run the model again. Try adjusting Smin and Smax with the sliders: optimize away!
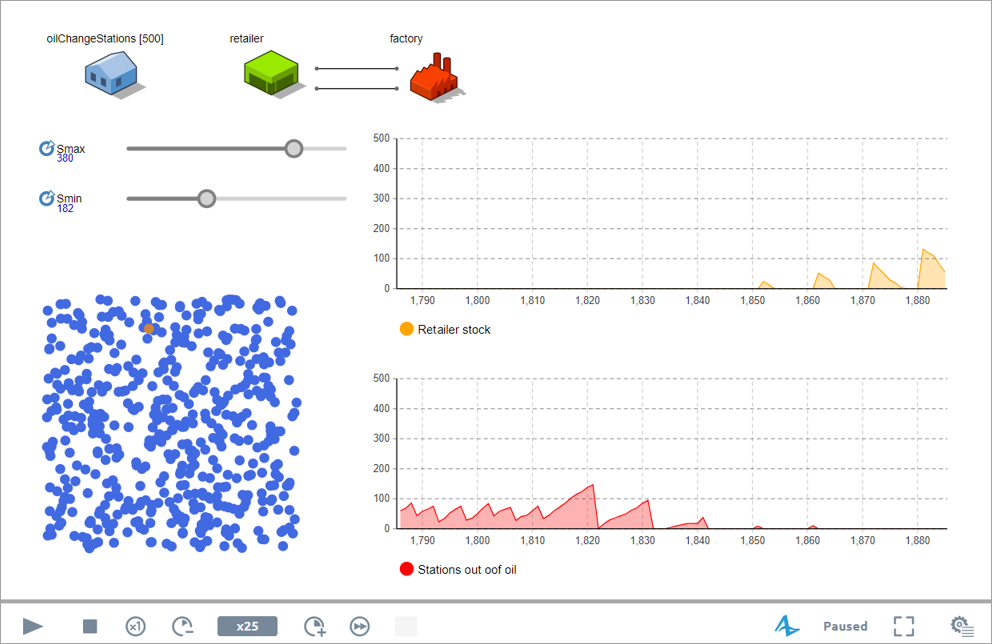
Although we have the plots with retailer inventory and stations out of oil and can visually assess both, we have not yet created formal numerical metrics for either! They are, as you may recall, average retailer inventory and maximum percentage of stations out of oil at any given time.
-
How can we improve this article?
-


