


In the first phase, we will create a simple model simulating a pedestrian flow: how people move inside our building.
Create a new model
- Log in to AnyLogic Cloud at https://cloud.anylogic.com.
- Click the My models tab to open the page containing your models.
- Now click + New model to open the Create new model dialog box.
-
In the Create new model dialog box that appears, specify the name of the new model: Subway Entrance Hall.
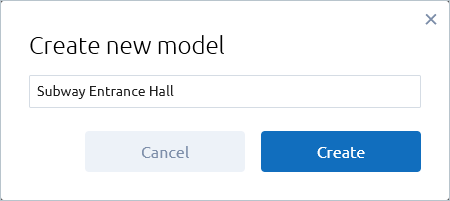
- Finally, click Create.
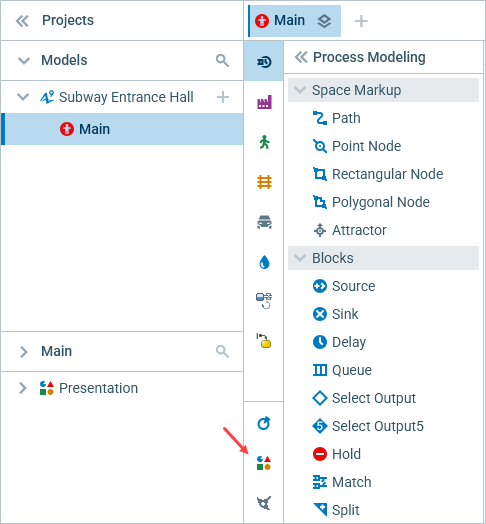
The newly created model has one agent type called ![]() Main.
Agents are the main building blocks of AnyLogic models.
In our case the Main agent will contain all the logic of the model
(the drawing of the entrance hall, and the flowchart describing the pedestrian flow).
Main.
Agents are the main building blocks of AnyLogic models.
In our case the Main agent will contain all the logic of the model
(the drawing of the entrance hall, and the flowchart describing the pedestrian flow).
The graphical editor is in the center of the workspace.
It shows the diagram of the ![]() Main agent type.
Main agent type.
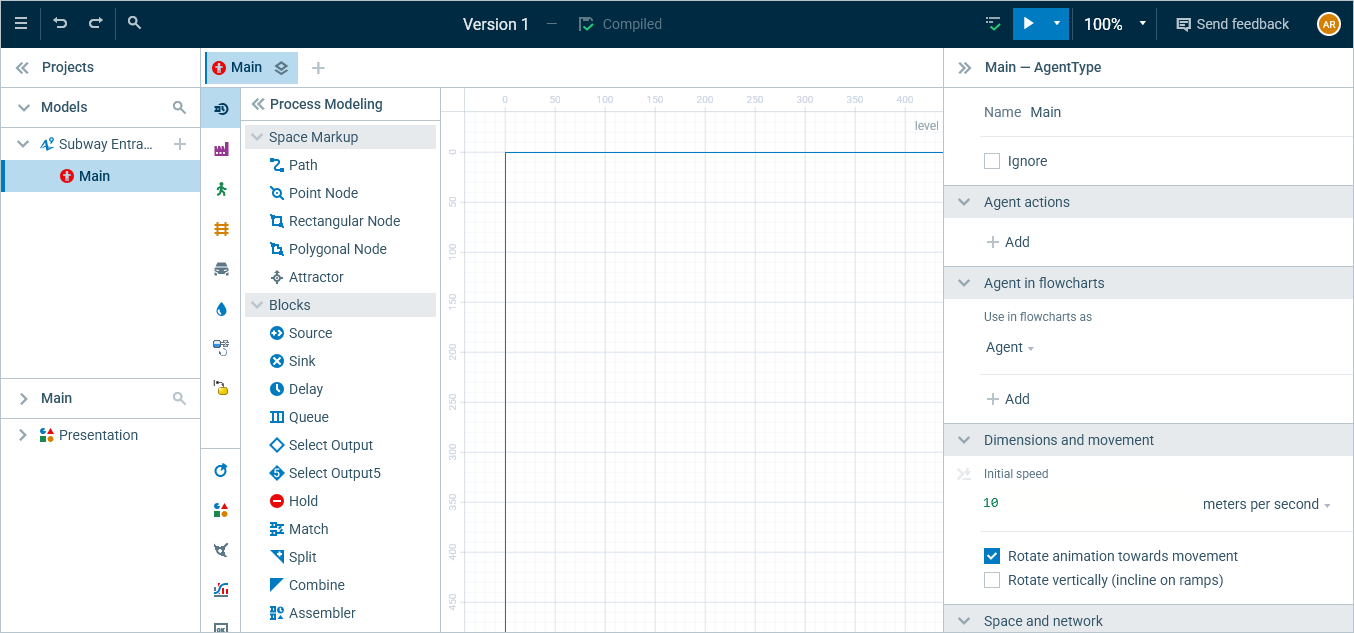
The left sidebar contains the Projects view and the Palette view.
The ![]() Projects view provides access to AnyLogic models that are currently open in the workspace.
The workspace tree provides easy navigation throughout the models.
The Palette view contains all graphical elements that can be dragged and dropped onto the graphical editor of your agent.
Model elements are grouped by categories in a number of palettes.
Projects view provides access to AnyLogic models that are currently open in the workspace.
The workspace tree provides easy navigation throughout the models.
The Palette view contains all graphical elements that can be dragged and dropped onto the graphical editor of your agent.
Model elements are grouped by categories in a number of palettes.
The right sidebar contains the Properties view, which shows the properties of the currently selected element.
Let us open the properties of the model to change the time measurement unit that will be used by the model.
Change the model time units
-
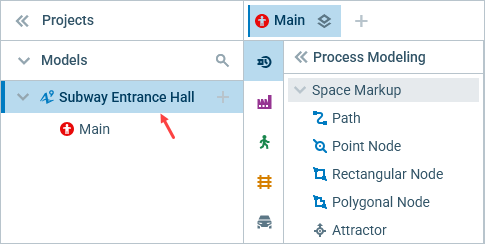
Select the Subway Entrance Hall model from the list of models in the
 Projects view to open its properties.
-
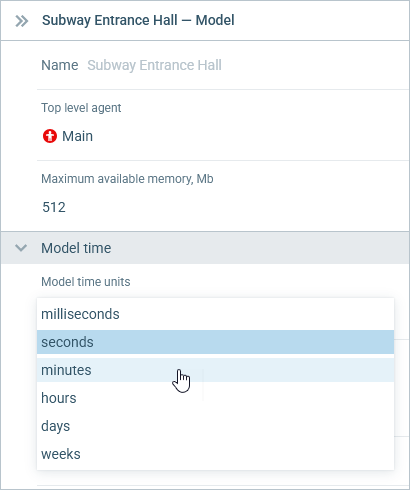
In the Properties view find the Model time section, and click seconds (the default time measurement unit) to open the Model time units
drop-down list, then click minutes to set the new time measurement unit.
Developing a pedestrian dynamics simulation model always starts with adding a layout image (drawing) of the simulated space (building). Then you draw walls over this image, and define the process logic, which describes how the pedestrians move inside this building.
Let us start with obtaining the layout image
Save the subway entrance hall layout to your computer
-
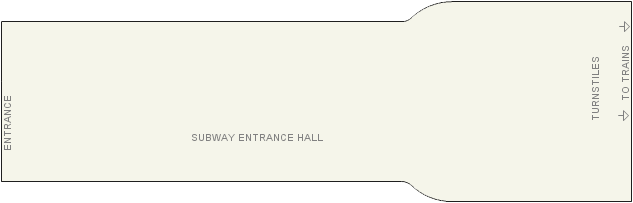
Right-click the image below, select Save image as from the context menu, then select the folder to save the image into.
Now add this image to the model’s canvas.
Add the layout to the canvas
-
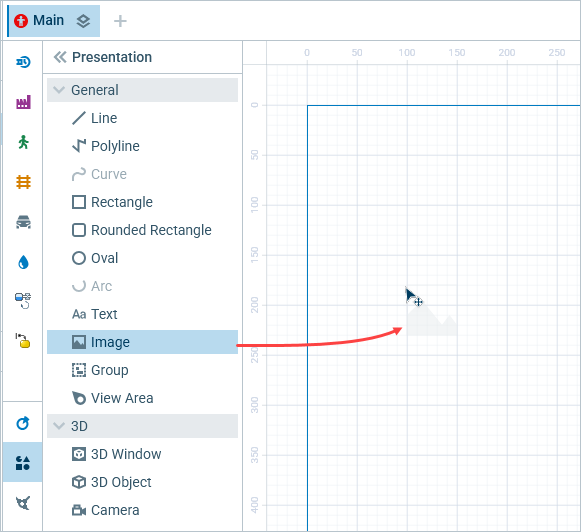
Open the
 Presentation palette of the Palette view by clicking in the vertical ribbon docked to the left part of the palette.
-
Drag the
 Image element from the
Presentation palette onto the
Image element from the
Presentation palette onto the
 Main graphical diagram.
-
Choose the image file to add to the canvas by navigating to it in the automatically opened file browser.
Click Open in the dialog box.
The image will be added to the canvas: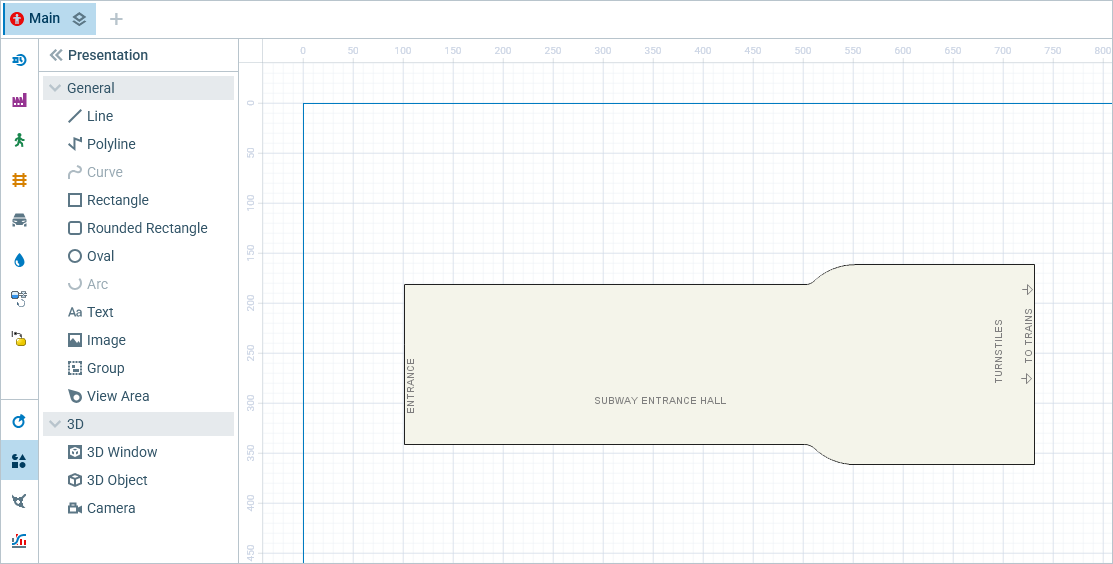
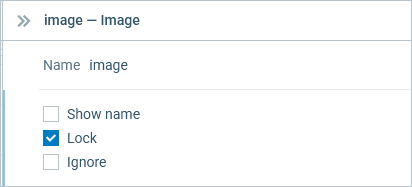
- In the Properties view, select the Lock checkbox to lock the image.
Locked shapes do not react to mouse clicks — it is impossible to select them in the graphical editor until you unlock them.
The layout image must be locked, since we will draw other shapes over it, and we want to avoid accidental selection of the image.
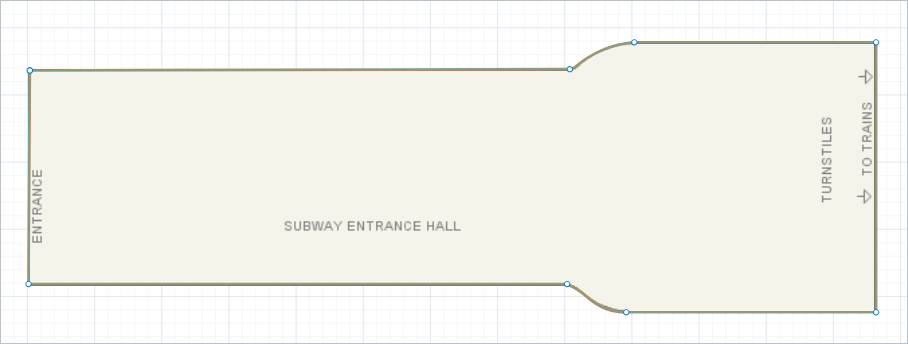
There are just a few zones marked on this image. We want to experiment with different layouts. We currently do not know where the ticket offices and ticket vending machines will be located. That is the reason why these areas are not marked on the image.
Now we will mark up the space of our model. Usually we start with drawing the building walls.
Draw the building walls
-
Open the
 Pedestrian Library palette.
-
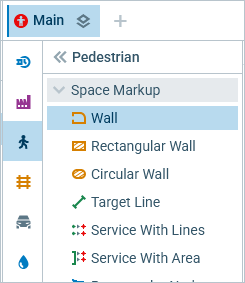
Activate the wall drawing mode by clicking the
 Wall element in the
  Space Markup section of the Pedestrian Library palette.
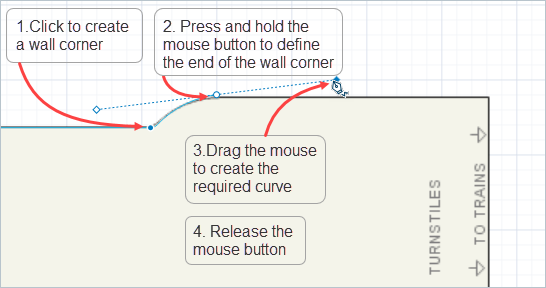
- Now draw the wall over the layout image by subsequently clicking at the points where you want to create wall corners. Every click appends a linear segment to the wall you are drawing.
-
Append a curved segment by pressing and holding the left mouse button at the point where the curved segment ends. Now move the mouse to change the curving radius.
To draw the circular segment, move the mouse exactly along the grid line. When done, release the mouse button.
-
Finally, double-click to place the last point and finish drawing the wall.
If you find it hard to draw a wall of exactly the same shape within one iteration, try drawing it with several ![]() Wall shapes.
Wall shapes.
Now you should define entry and exit points for the pedestrian flow.
Start with drawing the entry line first.
Pedestrians will enter the simulated environment here.
This line is drawn with the ![]() Target Line markup element.
Target Line markup element.
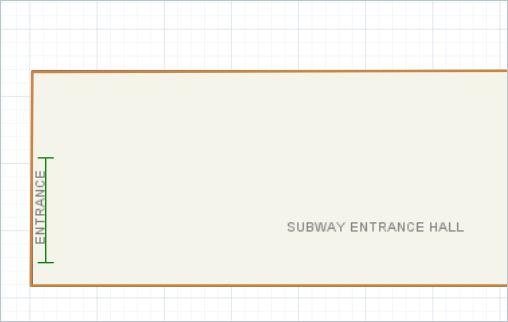
We will place the entry line next to the ENTRANCE on our layout.
Draw the line where passengers appear
-
Drag the
 Target Line element from the Space Markup section of the Pedestrian Library palette onto the graphical editor.
-
Resize it and place it exactly as shown in the figure below:
-
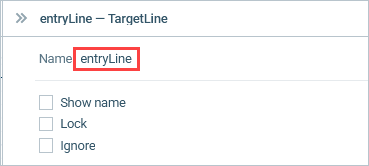
Name the line entryLine.
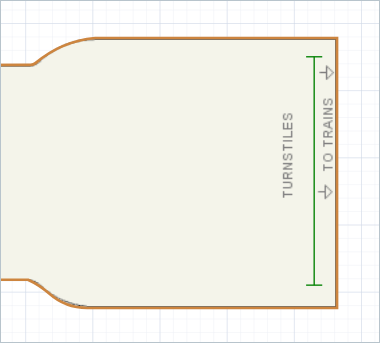
Now let’s add another target line that will define the destination of the passengers flow.
We want the passengers to move to the subway trains, so this target line must be placed next to the TO TRAINS spot.
Draw the target line
-
Draw another target line and place it as shown in the figure below.
After entering the subway station, the passengers will get to subway trains through this line.
Now we will define the pedestrian flow process with a flowchart comprising the Pedestrian Library blocks.
We will start with a simple process, in which the passengers enter the subway station through the ![]() entryLine, and then move to the trains through the
entryLine, and then move to the trains through the ![]() targetLine.
targetLine.
In AnyLogic the flowcharts are created by adding the blocks from the library palette to the graphical diagram, setting up parameters of the blocks, and connecting the blocks together.
Create the model flowchart
-
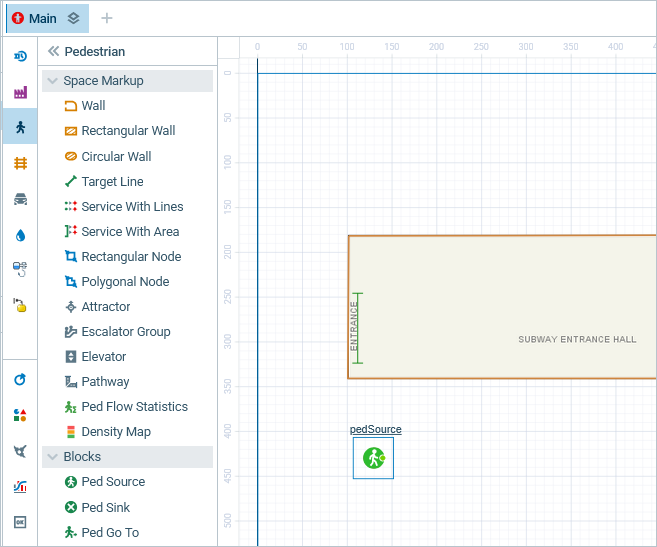
Click and drag the
 PedSource block from the Pedestrian Library palette onto the canvas, and drop it below the layout image.
-
In the same way add the
 PedGoTo and
  PedSink blocks to the canvas, and connect them as shown in the figure below.
When placing the blocks close to each other the lines connecting the blocks will appear. These connectors should connect only the ports on right and left sides of the block icons. Connecting the PedSink port to the lower port of PedGoTo block will cause an error.
PedSink blocks to the canvas, and connect them as shown in the figure below.
When placing the blocks close to each other the lines connecting the blocks will appear. These connectors should connect only the ports on right and left sides of the block icons. Connecting the PedSink port to the lower port of PedGoTo block will cause an error.
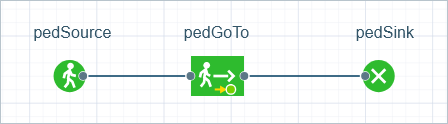
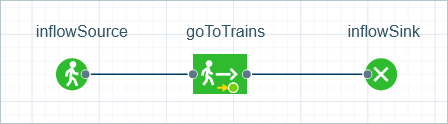
- Rename the blocks.
Name them inflowSource, goToTrains, and inflowSink respectively.
You can do this in the blocks’ properties.
Let’s say a couple of words about these flowchart blocks.
-
The PedSource block generates pedestrians.
It is usually used as a starting point of the pedestrian flow. In our example, it models arrival of the passengers.
-
The PedGoTo block moves pedestrians from the current location to the next one.
We will use this block to model how passengers move from the entry point to the subway trains.
-
The PedSink block disposes the pedestrians that enter it.
It is usually used as an end point of the pedestrian flow.
Refer to the Pedestrian Library Reference Guide for the detailed information on all Pedestrian Library blocks.
Configure the flowchart blocks
-
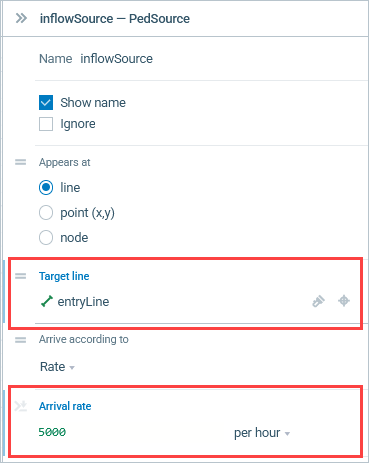
Select the inflowSource block to open its properties.
In the Properties view, define the entry point, from which the passengers will appear by clicking the Target line drop-down list and selecting the
entryLine item (the name of the Target Line element that is located at the ENTRANCE point).
Alternatively you can click the Select on canvas
and select this element in the graphical editor.
Select on canvas
and select this element in the graphical editor.
-
Set passengers Arrival rate to 5000 per hour.
-
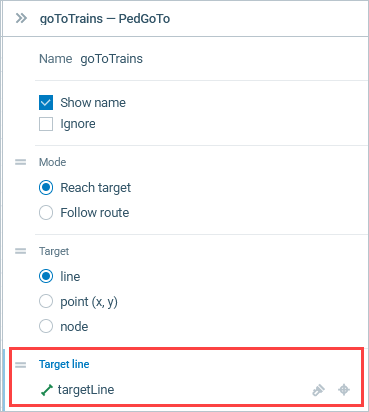
Now modify the properties of the GoToTrains block.
Specify destination for passengers, to which they will move once in the building.
Click the Target line drop-down list and select the
targetLine item (the name of the Target Line element that is located at the TO TRAINS point).
-
Leave the default properties of the PedSink block.
The flowchart is completed! Let us run the model.
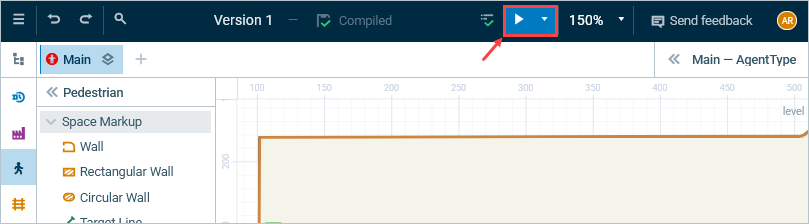
Start the model
- Click the
 Play button in the toolbar, or press F10 on your keyboard.
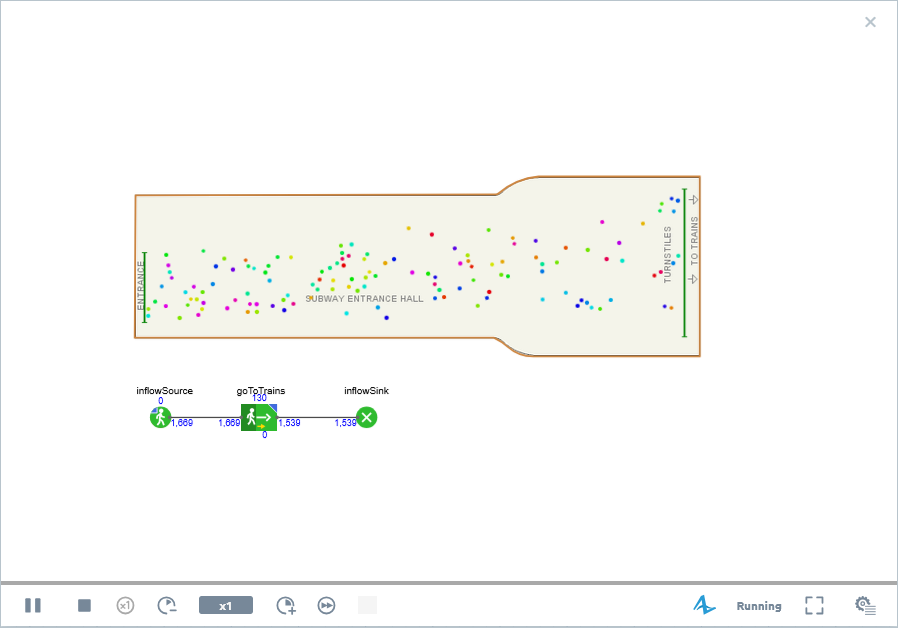
Having started the model, you will see the presentation of your top-level agent, ![]() Main.
You can see passengers entering the subway entrance hall and passing through it to the subway trains.
Main.
You can see passengers entering the subway entrance hall and passing through it to the subway trains.
OK, great! We have created a simple model in a very short time.
Let us proceed to the next phase of this tutorial..
-
How can we improve this article?
-