


The AnyLogic graphical editor is the space where you build your model using visual elements, define the agents’ structure, design the simulation animation and arrange the presentation including the animation window. It serves as an infinite work area and hosts the rulers, the axes, the diagram grid, the scale adjustment element, and the model frame defining the area visible at runtime.
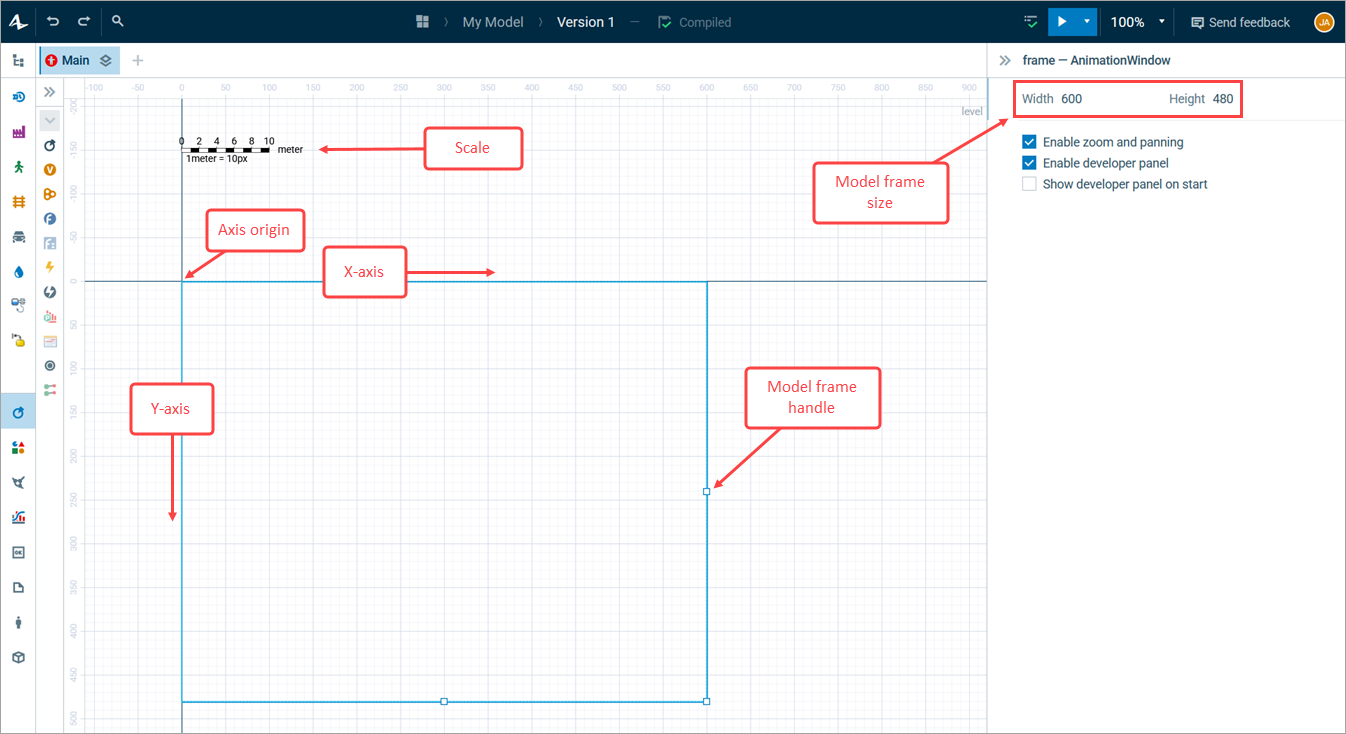
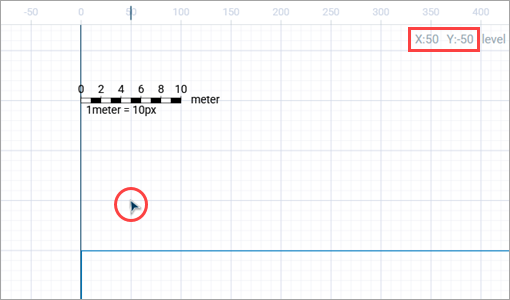
When you open a model in the graphical editor, you see the rulers, the axes, and the diagram grid. As the editor is coordinate-based, the rulers (one on the top and one on the left of the work area) provide reference values, and the axes help with navigation in the 3D space. The diagram grid serves as an aid so that it is easier for you to organize your diagram. The current mouse coordinates are displayed in the top right corner.
The axes are represented by deep blue grid lines. They define the left and upper borders of the visible area of the diagram. The lower and right borders of the visible area are defined by the settings of the model frame and are the same for all agent types.
The coordinates for the visual elements can be found and adjusted in the Position and size section of the element’s properties.
The graphical editor can display a grid, which supports snapping elements to it and simplifies arranging and aligning shapes. By default, the grid is shown, and snapping elements to it is enabled.
At 100% zoom, grid cells are 10 by 10 pixel squares. When moving or resizing a shape with the grid enabled, the corresponding shape’s properties, such as its coordinates and dimensions, change in 10 pixel increments. This can be helpful when you need to draw shapes with the same dimensions, or place them exactly opposite one another.
Changing the zoom level affects the grid step. For example, at 200% zoom the grid step is 5 pixels, and at 800% the grid step is 1 pixel.
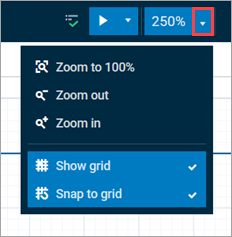
To toggle the grid and snapping to grid
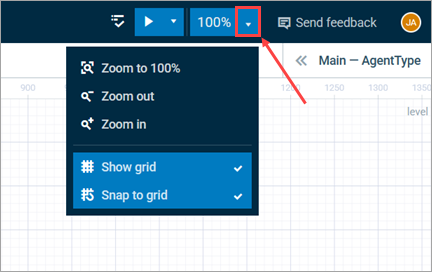
- Open the zoom drop-down menu by pressing the toolbar button next to the zoom percentage.
- Along with the zoom options, you can see two checkboxes: Show grid and Snap to grid. To enable the grid, check the corresponding box. When Show grid is unchecked, the grid is hidden, but this does not affect the snapping: if the grid is enabled but not shown, shapes still snap to it.
Above the X-axis you can see the ![]() Scale element showing the ratio between the actual size of the model elements and their size in pixels. You can adjust the scale graphically (by dragging it's handle—for instance, along the element you are using for reference, or by setting its length in pixels in the properties) or explicitly (by setting the length in actual units).
Scale element showing the ratio between the actual size of the model elements and their size in pixels. You can adjust the scale graphically (by dragging it's handle—for instance, along the element you are using for reference, or by setting its length in pixels in the properties) or explicitly (by setting the length in actual units).
The model frame defines the size of the model window and the part of the graphical diagram that is shown in the window at the model runtime. Its settings are shared between all agent types in the model. When an agent type is open in the graphical editor, the model frame is represented by a blue frame.
To change the frame size, select it in the graphical editor and drag its handles. Alternatively, you can set the size of the frame by specifying the Width and Height in its properties. The top left corner of the model frame is always at the axis origin (0, 0).
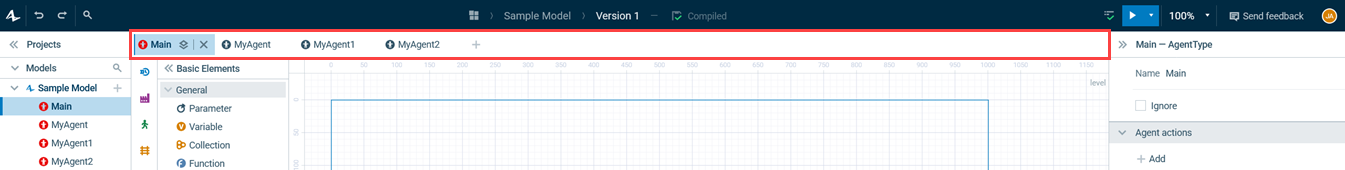
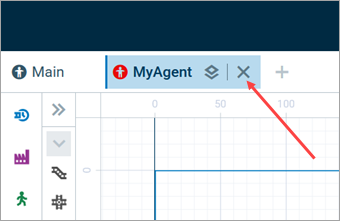
On top of the coordinate space and the rulers you can always see at least one tab. These tabs serve as separate pages for agent types from the model you are currently working with and allow access to the respective graphical diagrams.
When you open a model, the Main tab is open and active by default. A new tab opens automatically for every new agent type created. To open a tab for an already existing agent type, select one of your agent types from the model's project tree. You can sort the tabs in the component bar by dragging them.
Tabs from different models can not be open simultaneously: whenever you open a tab that belongs to a different model, all the tabs that were previously open are automatically closed. The last open tab cannot be closed.
To create a new agent type
- On the tab bar, to the right of the tabs, click . The New agent type wizard will appear.
- Enter the name for your agent in the Name field. Spaces are not allowed.
- Optionally, select an image in the Animation shape pop-up. It will represent your agent type in the animation when you play it.
- Optionally, you can click Next and add parameters to your agent type.
- Click Finish.
Each agent type has a graphical diagram associated with it. Represented by a tab in the graphical editor, it is the space where you define the structure of your agent type.
To design a multi-level agent, such as a building with more than one floor, or select an existing level, use the icon in the tab header, next to the agent type name. You can learn more in the Levels section of AnyLogic Help.
To close a tab
- Click .
You can move, center, or zoom in on the diagram to take a better look at particular parts of it.
To pan the view
- Right click an empty space in the editor and hold. Move the mouse.
To pan the view on macOS or Linux
-
While developing the model, use the following commands:
- macOS: Space + click, then drag your mouse
- Linux: Space + right or left click, then drag
-
In run mode, use the following commands:
- macOS: Cmd + click, then drag
- Linux: left click, then drag
To zoom in
-
Press Ctrl (macOS: Cmd) and, while holding it down, scroll the mouse wheel up, or
Click the Zoom in toolbar button.
To zoom out
-
Press Ctrl (macOS: Cmd) and, while holding it down, scroll the mouse wheel down, or
Click the Zoom out toolbar button.
To restore zoom to 100%
- Click the Zoom to 100% toolbar button.
You can also set the diagram scale using the Zoom menu on the toolbar.
To work in the graphical editor faster, you can use a number of hotkeys and mouse shortcuts.
| Windows and Linux |
macOS | Description |
|---|---|---|
| Ctrl + + | Cmd + + | Zoom in the graphical editor. |
| Ctrl + - | Cmd + - | Zoom out the graphical editor. |
| Ctrl + 0 | Cmd + 0 | Zoom the graphical editor to 100%. |
| Ctrl + X | Cmd + X | Cut the currently selected element or elements to the clipboard. |
| Ctrl + C | Cmd + C | Copy the currently selected element or elements to the clipboard. |
| Ctrl + V | Cmd + V | Paste the element or elements from the clipboard. |
| Del | Del | Delete the currently selected element |
| Arrow keys | Arrow keys | Move the selected elements up, down, left, or right, in 10 pixels increments. |
| Ctrl + Z | Cmd + Z | Undo the previous action. |
| Ctrl + Y | Cmd + Y | Redo the previously undone action. |
| Windows and Linux |
macOS | Description |
|---|---|---|
| Ctrl + scroll | Cmd + scroll | Zoom the diagram in or out. |
| Alt + click | Option + click | Select a single element belonging to a group (or a single markup shape from a complex markup element). |
| Ctrl + drag | Cmd + drag | Create a copy of the current selection. |
| Shift + drag | Shift + drag | Shift the current selection horizontally or vertically while maintaining vertical or horizontal center alignment. |
-
How can we improve this article?
-