


The Ped Flow Statistics is a graphical markup element that collects statistics on pedestrians crossing the drawn cross-section.
You draw its line on the animation and it will collect statistics on the number of pedestrians crossing that particular line. For example, you can draw the line of the element across a corridor, and it will count statistics on pedestrians passing through that corridor.
You can count pedestrians crossing the line either in one particular direction or in both directions (this is configured by the element parameters).
Using the traffic() and intensity() functions of the element, you can get the corresponding pedestrian traffic and intensity values.
Traffic is calculated as the number of pedestrians that have recently crossed the line in the specified direction. See the Functions section for details.
Intensity is calculated as the traffic value divided by the line length (in meters) and is measured in pedestrians/(hour*meter).
Demo model: Pedestrian Flow Statistics Open the model page in AnyLogic Cloud. There you can run the model or download it (by clicking Model source files). Demo model: Pedestrian Flow StatisticsOpen the model in your AnyLogic desktop installation.To add the Ped Flow Statistics line on the graphical diagram
- Drag the
 Ped Flow Statistics element from the Space Markup section of the
  Pedestrian Library palette to the graphical diagram.
 - Place the line where you want it by dragging its endpoint.
- General
-
Name — The name of the shape. The name is used to identify and access the shape from code.
Show name — If selected, the name of the shape is displayed in the graphical editor.
Lock — If selected, the shape is locked. Locked elements do not respond to mouse clicks, and they cannot be selected in the graphical editor until you unlock them. This is often needed when you want to prevent the element from being edited while other elements are placed over it.
Ignore — If selected, the shape is excluded from the model.
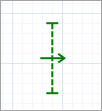
Direction — Specifies the direction of pedestrian movement to be considered when collecting the statistics. You can collect statistics for pedestrians crossing the element’s line only to the Left, only to the Right, or in Both directions. The arrow indicating the selected direction is drawn in the graphical editor to make things easier for the modeler.
- Appearance
-
Line color — The line color.
- Position and size
-
Level — The level this line belongs to. Statistics will be collected on all pedestrians crossing the element’s line in the specified Direction on this level.
X — The X-coordinate of the line (its start point).
Y — The Y-coordinate of the line (its start point).
dX — The X-offset of the end point regarding the start point of the line.
dY — The Y-offset of the end point regarding the start point of the line.
- Visibility and presentation
-
Visible — If selected, the shape is visible during animation at model runtime.
Show in — Select whether the shape is displayed in both 2D and 3D animation, 2D only, or 3D only.
Agent presentation — If selected, the shape is also visible on the upper-level agent that hosts the agent containing this shape.
- Flow statistics
-
Function Description long countPeds() Returns the total number of pedestrians passed through the line. double traffic() Returns the pedestrian flow traffic value, in pedestrians/hour. The traffic value is calculated as the number of pedestrians that crossed the cross section line in the specified direction (set by the element’s parameters) during the last five minutes (in terms of model time). To get the value in pedestrians/hour, the observed number of pedestrians is multiplied by 12.
During the warm-up period (the first five minutes of the simulation and first five minutes after the statistics reset), traffic statistics is collected as well. However, the same formula (observed number of pedestrians multiplied by 12) is used regardless the actually shorter statistics collection period.double intensity() Returns the pedestrian flow intensity, in pedestrians/(hour*meter). The intensity is calculated as the traffic value divided by the line length (in meters). void reset() Resets the traffic and intensity values collected by this element. - Flow direction
-
Function Description FlowStatisticsDirection getDirection() Returns the current flow direction, for which this element collects statistics.
Valid values:
FLOW_STATISTICS_LEFT
FLOW_STATISTICS_RIGHT
FLOW_STATISTICS_BOTHvoid setDirection(FlowStatisticsDirection direction) Sets the flow direction, for which this element will collect statistics.
direction — the new direction.
Valid values:
FLOW_STATISTICS_LEFT
FLOW_STATISTICS_RIGHT
FLOW_STATISTICS_BOTH - Color
-
Function Description Color getColor() Returns the color of the shape. void setColor(Color color) Sets the color of the shape.
color — the new color - Visibility
-
Function Description boolean isVisible() Returns true if the shape is visible; returns false otherwise. void setVisible(boolean v) Sets the visibility of the shape.
v — visibility. If v is true — the shape is set to be visible, if it is false — not visible. - Level
-
Function Description Level getLevel() Returns the level this space markup shape belongs to.
-
How can we improve this article?
-