


Initially we assumed that all passengers had bought their tickets in advance, that is why they passed through the hall directly to the trains. This may be true for some passengers, while the rest of them should buy tickets when they enter the subway station.
There can be different ticket vending facilities in the subway station. Small subway entrances may offer only ticket vending machines, while big and spacious stations can additionally have ticket offices.
Let’s expand our model by adding ticket vending machines first. The expanded model will allow us to tell the number of machines required to satisfy the passenger needs, as well as the optimal location for the machines to minimize the passenger flows, intersections and crowds.
Like the fare gates, the ticket vending machines can also be represented by the Services with Lines.
Add ticket vending machines
-
Drag the
 Service With Lines element from the Space Markup section of the
 Pedestrian Library palette into the graphical editor.
-
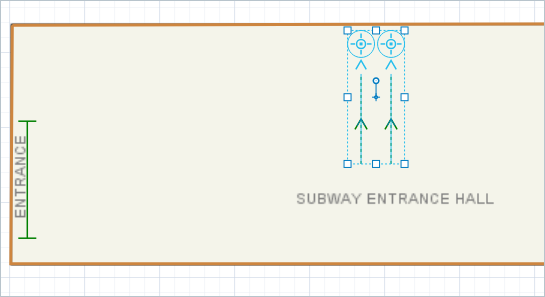
Rotate the service shapes and place them near the wall as shown in the figure below:
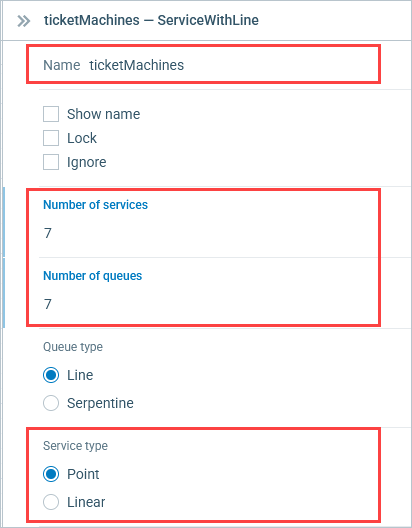
- Change the Name of the element to ticketMachines in its properties.
- Leave the Type of service parameter set to the Point option. This time our services are not linear, but point. Pedestrian reaches the service point and stays there for the service delay time.
-
Increase the Number of services and Number of queues to 7.
Now we want to divide the flow by guiding some passengers to the fare gates, and other passengers to the ticket vending machines.
Modify the model flowchart
-
Insert the
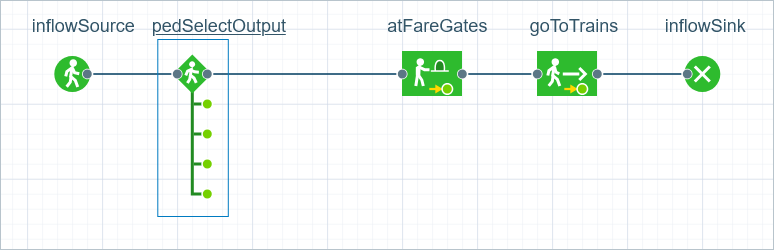
 PedSelectOutput block between inflowSource and atFareGates blocks.
The block will be automatically connected when you place it over the connector. This block will divide the passenger flow by routing the non-ticketed passengers to the ticket vending machines, while leaving the rest on their way to the fare gates.
PedSelectOutput block is a decision making block of the
Pedestrian Library.
Pedestrians arriving at the PedSelectOutput block are forwarded along one of its output ports depending on the specified ratios.
-
Configure the PedSelectOutput block:
- Name it routePassengers.
- Set Probability 1 to 0.9 to define the ratio for passengers within the flow going directly to the fare gates. We assume that the number of passengers that have already bought their tickets is significantly higher than the number of the non-ticketed passengers.
- Set Probability 2 to 0.1 to define ratio for the passengers within the flow going to the ticket vending machines.
- Set Probability 3, 4, 5 to 0.
-
Now add another
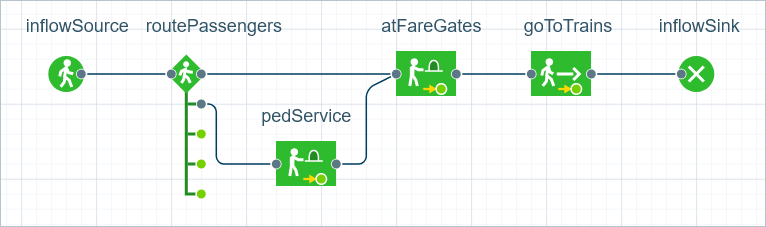
 PedService block to the flowchart.
Place it below the connector line between the PedSelectOutput (routePassengers)
and the PedService (atFareGates) blocks.
Connect its left port to the second
out port of the routePassengers block, and its right port to the
(atFareGates) block.
This block will simulate how passengers are serviced at the ticket vending machines.
PedService block to the flowchart.
Place it below the connector line between the PedSelectOutput (routePassengers)
and the PedService (atFareGates) blocks.
Connect its left port to the second
out port of the routePassengers block, and its right port to the
(atFareGates) block.
This block will simulate how passengers are serviced at the ticket vending machines.
-
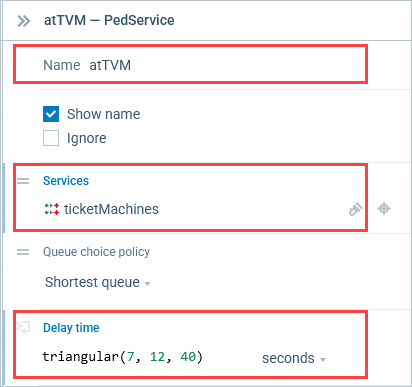
Configure the just added PedService block:
- Rename the block to atTVM.
-
Open the Services drop-down list and select
 ticketMachines
(the name of our Service with Lines markup shape).
ticketMachines
(the name of our Service with Lines markup shape).
-
Change the default Delay time value by typing triangular(7, 12, 40).
Make sure that the time measurement unit is set to seconds.
We assume that service time is triangularly distributed with the minimum value of 7 seconds, average value of 12, and the maximum value of 40 seconds.
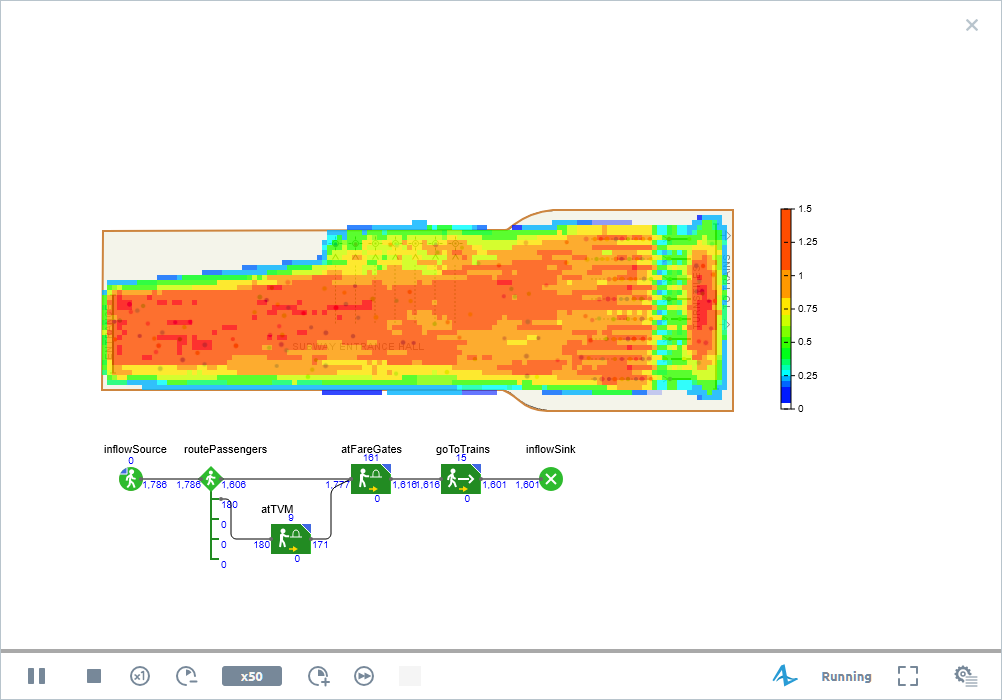
Let’s run the model and observe its behavior. Some passengers first go to the ticket vending machines to buy a ticket and only then pass through the fare gates.
We have successfully completed this tutorial!
-
How can we improve this article?
-