


The Curve is one of the primitive presentation shapes that you can use to draw presentations for your models.
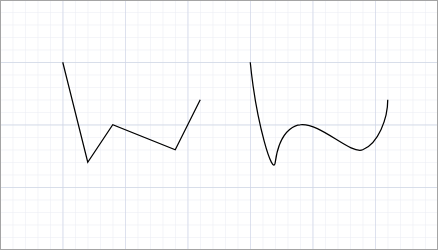
It is a freeform shape that is drawn in the same manner as a polyline — as a set of vertices that are sequentially connected. The difference is that the curve vertices are connected not to straight lines, but to curved segments that make up a periodic spline. The picture below shows you a polyline and a curve, both drawn for the same set of vertices:
To draw a curve
- Click the
 Curve element in the
  Presentation palette.
 - Click in the graphical editor at the position of the first point of the curve.
- Subsequently click at other points where you want to place other salient points.
- Double-click to place the end point and finish drawing.
- To create a closed curve you should not create its first and last points at the same position. Instead, right-click the finished curve and select Close curve from the context menu or check the Closed checkbox in the element properties. The final segment is then drawn automatically.
Each vertex of the curve can be controlled during the model execution.
You can specify dynamic expressions that would define the number and the coordinates of the curve vertices at runtime.
- General
-
Name — The name of the shape. The name is used to identify and access the shape from code.
Show name — If selected, the shape name is displayed in the presentation diagram.
Lock — If selected, the shape is locked. Locked shapes do not react to mouse clicks — it is impossible to select them in the graphical editor until you unlock them. It is frequently needed when you use a shape as a background image for your animation and you want to prevent editing this shape while drawing other shapes over it.
Ignore — If selected, the shape is excluded from the model.
- Appearance
-
Line color — The color of the curve. Click inside the control and select the required color or texture using the Colors dialog box. If you do not want the curve line to be visible, select no color.
You can specify an expression that will be re-evaluated dynamically. It should return an instance of the Color Java class.Fill color — The color of the curve fill. The curve is filled in the following way: a line connecting the curve starting and end points is drawn (if the curve is not closed already), and then the area inside the resulting shape is filled with color.
Click inside the control and select the required color using the Colors dialog box. Select no color if you do not want the area inside the curve to be filled.
Otherwise, specify here the expression defining the shape fill color.
The expression should return an instance of Java class Color. If it returns null, the shape is not filled.Line width — The width of the curve line. Select width using the buttons or enter the value in pixels in the field to the right. Enter 0 if you don't want a line to be drawn.
Line style — The style of the line. Using the buttons, select if the line will be solid, dashed, or dotted.
Closed — If selected, the curve is closed, i.e. its starting and end points are connected with an extra segment.
- Position and size
-
Level — The level to which this element belongs.
Position
X — X-coordinate of the curve (its starting point).
Y — Y-coordinate of the curve (its starting point).Rotation, rad — The shape rotation angle in the XY plane.
Scale
X — Here you can specify the expression returning the X-direction scale factor for the shape. *
Y — Here you can specify the expression returning the Y-direction scale factor for the shape. ** You can dynamically scale the shape at model runtime by specifying expressions in the Scale parameters. - Points
-
Number of points — Here you can specify the expression that will return the number of points of the curve.
dX[indexPt] — Here you can specify the expression for the X-offset of the curve point with the index indexPt regarding the starting point of the curve. Use the predefined symbol indexPt to refer to the current point index. The index value is zero based, i.e., the first point has index of 0.
dY[indexPt] — Here you can specify the expression for the Y-offset of the curve point with the index indexPt regarding the starting point of the curve. Use the predefined symbol indexPt to refer to the current point index. The index value is zero based, i.e., the first point has index of 0.
- Actions
 Add — Here you can specify a trigger that will start the code execution.
On click — Here you can insert Java code that will be called each time a user clicks on the shape at model runtime. If there are several shapes overlapping in the click point, the click will interact with the topmost shape only.
Local variables:
self — the element itself.
clickx — x-coordinate of the click relative to the shape coordinates.
clicky — y-coordinate of the click relative to the shape coordinates.
- Visibility and presentation
-
Visible — Here you specify whether the shape is visible in the animation at model runtime. If you expect visibility to change dynamically or to depend on some conditions, you may specify the expression defining the shape visibility here. This expression will be dynamically re-evaluated at model runtime. It should return a boolean value. The shape is visible when the specified expression evaluates to true, and not visible otherwise.
Agent presentation — If selected, the shape is included in the agent presentation. This means that if the agent hosting this shape is embedded in another agent, the shape will remain visible.
Agent icon — If selected, the shape is considered a part of the agent icon. Please note that icon shapes are not shown in 3D animation.
- Expert
-
Replication — The replication factor of the shape. Here you specify how many copies of the shape will be created (an integer number). If you leave this field empty, only one shape will be created.
To move a vertex of a curve
- Select the curve. You will see the curve vertices highlighted with small blue circles.
- Drag the curve vertex.
To add a new vertex to a curve
- Select the curve. You will see the curve vertices highlighted with small blue circles.
- Double-click the curve at the point where you want to add a new vertex.
To remove a vertex of a curve
- Select the curve. You will see the curve vertices highlighted with small blue circles.
- Double-click on the curve vertex you want to remove.
AnyLogic supports editing curves using guiding lines — a widely spread and convenient way of curve editing that enables users to draw curves of any complexity and shape.
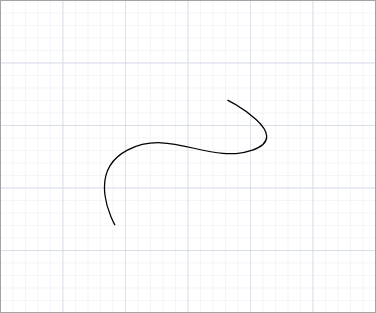
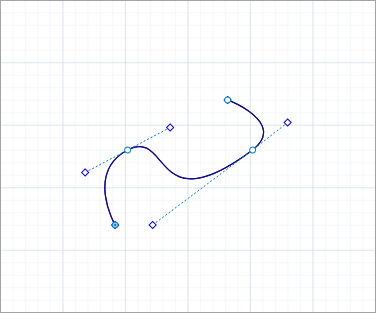
Let us explain how you can change the shape of a curve using its guiding lines. We will illustrate the operations with the curve drawn below:
To switch to the guiding lines mode
- Right-click (macOS: Ctrl + click) the curve and select Show guiding lines from the context menu.
-
You will see dotted lines tangent to curve vertices with little squares on their ends. These are guiding lines with handles.
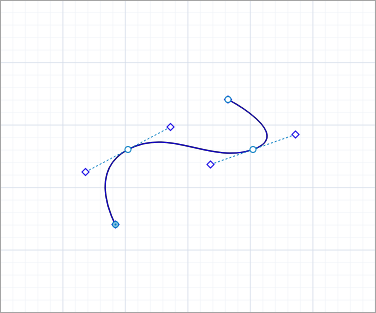
Using these handles, you can change the length and orientation of the corresponding guiding line. This way you change the curve tangent orientation and, consequently, the shape of both adjacent curve segments. When manipulated, the shape will be highlighted.
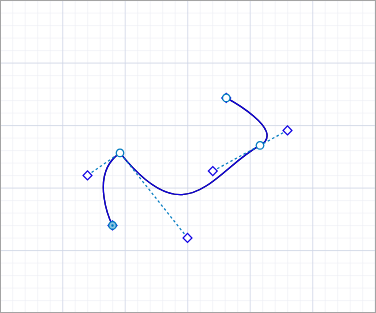
To change the shape of two adjacent curve segments
- Drag any of the two handles of a guiding line tangent to the vertex. Move the handles clockwise or counterclockwise until the segments will take the required shape.
-
The figure below illustrates how the rotation of the left vertex guiding line affected the shape of the neighboring curve segments:
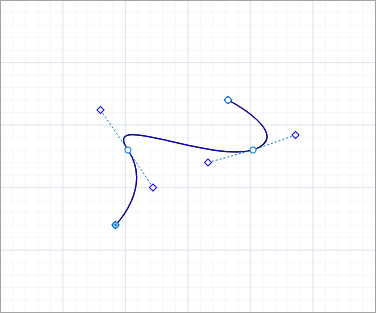
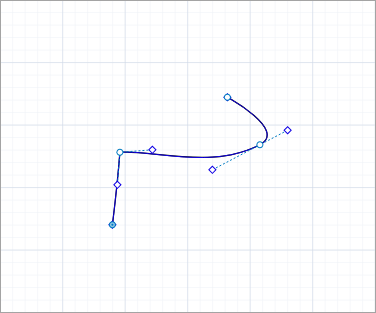
The length of a guiding line defines the convexity of a curve segment in the corresponding vertex.
To change the convexity of a curve
- Drag a guiding line handle away from the vertex or closer to it. The longer the guiding line gets, the more bulged the curve segment becomes, and vice versa.
-
The figure below illustrates how the stretching of the right vertex guiding line affected the convexity of the neighboring curve segments:
The manipulations described above change the appearance of both curve segments adjacent to a curve vertex. However, to create asymmetrical curves or corners, you may need to change the appearance of only one particular curve segment. In this case you should work with only one handle corresponding to this segment, as described below.
To change the shape of a single curve segment
- Move the required handle using Ctrl + drag (macOS: Cmd + drag).
To create a corner point
- Right-click the curve vertex point where you want to create a corner.
- In the context menu, select Point › Corner point.
To split a curve into two curve shapes
- Right-click the curve and select Split from the context menu.
- Click the curve vertex point where you want to split the shape into two individual shapes.
To append new segments to a curve
- Right-click the curve and select Append from the context menu.
- Click one of the two curve end points to indicate where you want to append new segments to it.
- Draw the new segments in the same way you draw the curve.
The Edit shape mode allows you to resize and rotate the entire curve instead of moving vertices and shaping individual segments.
To resize a curve
- Right-click (macOS: Ctrl + click) the curve and select Edit shape from the context menu.
- You will see the selection rectangle drawn. Drag the required handle on the selection rectangle's border to resize the shape correspondingly.
To rotate a curve
- Right-click (macOS: Ctrl + click) the curve and select Edit shape from the context menu.
- You will see the selection rectangle with a pivot point handle in the middle. Drag this handle clockwise or counterclockwise to rotate the shape.
- Location
-
Function Description double getX()
double getY()Returns the X (Y) coordinate of the shape (curve starting point). void setX(double x)
void setY(double y)Sets the X (Y) coordinate of the shape (curve starting point). This function not just changes the coordinate of the curve starting point, but moves the curve to the new location.
x — the new value of the X coordinate.
y — the new value of the Y coordinate.void setPos(double x, double y) Sets new coordinates for the shape (curve starting point). Z-coordinate is left unchanged. This function not only changes the coordinate of the curve starting point, but moves the curve to the new location.
x — the new value of the x coordinate.
y — the new value of the y coordinate. - Point coordinates, length
-
Function Description int getNPoints() Returns the number of points of the curve. void setNPoints(int n) Sets the number of points in the shape. Does nothing if the number of points equals the current one. If it is different, the maximum possible set of points keep their coordinates in the new shape.
n — the new number of points.double getPointDx(int i)
double getPointDy(int i)Returns the X (Y) coordinate of a particular point of the shape relative to the starting point.
i — the index of the point (starting from 0).void setPoint(int i, double ptdx, double ptdy) Sets the coordinates of a particular point of the shape relative to the starting point.
i — the index of the point (starting from 0).
ptdx — the new X coordinate of the point relative to the starting point.
ptdy — the new Y coordinate of the point relative to the starting point.void setPointDx(int i, double ptdx)
void setPointDy(int i, double ptdy)Sets the X (Y) coordinate of a particular point of the shape relative to the starting point.
i — the index of the point (starting from 0).
ptdx — the new X coordinate of the point relative to the starting point.
ptdy — the new Y coordinate of the point relative to the starting point.boolean isClosed() Returns true, if the curve is closed, and false otherwise. void setClosed(boolean closed) Sets the curve closed or not.
closed — if true, the curve set to be closed, if false — not. - Scaling
-
Function Description double getScaleX()
double getScaleY()Returns the scale of the shape along X (Y) axis. void setScaleX(double sx)
void setScaleY(double sy)Sets the scale of the shape along X (Y) axis.
sx — the new value of scale along X axis. *
sy — the new value of scale along Y axis. *
void setScale(double sx, double sy) Sets the scales of the shape along both axes.
sx — the new value of scale along X axis. *
sy — the new value of scale along Y axis. *void setScale(double s) Sets the same scale of the shape along both axes.
s — the new value of scale along both axis. ** The value 1 means that the original size should be kept. - Rotation
-
Function Description double getRotation() Returns the rotation of the shape in radians, clockwise. void setRotation(double r) Sets the rotation of the shape.
r — the new value of rotation in radians. - Visibility
-
Function Description boolean isVisible() Checks the visibility of the shape. If the shape is visible, returns true, otherwise returns false. void setVisible(boolean v) Sets the visibility of the shape.
v — visibility: if true — the shape is set to be visible, if false — not visible. - Fill color
-
Function Description Color getFillColor() Returns the fill color of the shape, or null if shape has no fill color or has textured fill (in this case getFillTexture() should be used instead). Texture getFillTexture() Returns the fill texture of the shape, if the shape has fill texture. void setFillColor(Color fillColor) Sets the fill color of the shape.
fillColor — the new fill color, if null, the shape is not filled.void setFillColor(Object fillColor) Sets the fill color (or Texture) of the shape.
fillColor — the new fill color, if null, the shape is not filled. - Draw mode (2D / 3D)
-
Function Description ShapeDrawMode getDrawMode() Returns the drawing mode of the shape (it defines where this shape is drawn: in 2D, 3D or 2D+3D animation). Since curves can only be displayed in 2D animation, returns SHAPE_DRAW_2D. void setDrawMode(ShapeDrawMode drawMode) Sets the drawing mode of the shape (where to draw this shape: 2D, 3D or 2D+3D animation).
drawMode — the new draw mode of the shape.
Since curves can only be displayed in 2D animation, the only valid value is SHAPE_DRAW_2D. - Group
-
Function Description ShapeGroup getGroup() Returns the group containing this shape. - Level
-
Function Description Level getLevel() Returns the level where this shape is located. - Control points definition mode
-
Function Description boolean isManualControlPoints() Returns true if this curve uses manually specified control points (which are specified in the dx and dy arrays). void setManualControlPoints(boolean manualControlPoints) Sets control points mode: manual or automatic.
In the manual mode curve uses control points specified in the dx and dy arrays.
manualControlPoints — true for manually specified control points, false for automatically calculated. - Line appearance
-
Function Description Color getColor() Returns the color of the line, or null if the line has no color or has texture (in this case getTexture() should be used instead). Texture getTexture() Returns the line texture, if the line has texture. void setColor(Color color) Sets the line color.
color — the new line color, if null, the line is not drawn.void setColor(Object color) Sets the color (or Texture) of the line.
color — the new color, set to null to not draw the line.double getLineWidth() Returns the width of the line. void setLineWidth(double width) Sets the width of the line, 0 means thinnest possible.
width — the new width of the line.int getLineStyle() Returns the style of the line.
Valid values:
LINE_STYLE_SOLID — solid line.
LINE_STYLE_DOTTED — dotted line.
LINE_STYLE_DASHED — dashed line.void setLineStyle(int style) Sets the style of the line.
style — the new style of the line.
Valid values:
LINE_STYLE_SOLID — solid line.
LINE_STYLE_DOTTED — dotted line.
LINE_STYLE_DASHED — dashed line.
-
How can we improve this article?
-