


With AnyLogic, you can collect complicated statistics whenever you need them. The blocks of the Process Modeling are already capable of collecting the basic statistics. We can view the statistics collected for the flowchart blocks with charts.
We want to observe how mean ATM utilization and mean queue length change with time.
Add a bar chart to indicate mean ATM utilization
-
Open the
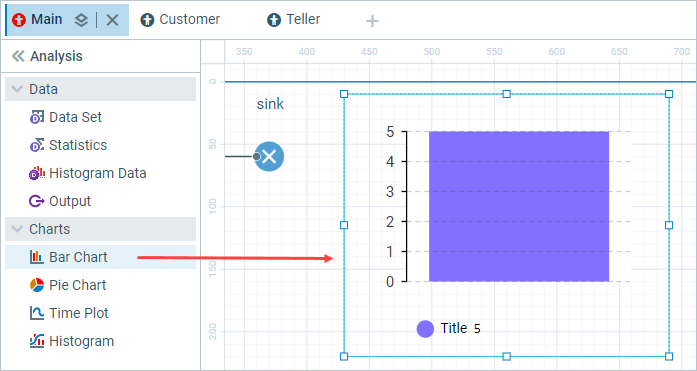
 Analysis palette. This palette contains charts and data objects used for collecting data and performing various statistical analysis on them.
 - Drag the
 Bar Chart element from the stencil into the graphical editor.
- Go to the Data section of the chart’s properties.
- Change the data item’s Title to ATM utilization.
-
Type ATM.statsUtilization.mean() as the Value of the data item.
ATM is the name of the
 Delay block we created. Each Delay block has a statsUtilization data set that collects statistics on the object utilization. The mean() is the function that returns the mean value measured. You can use other functions to get statistical values, such as min() and max().
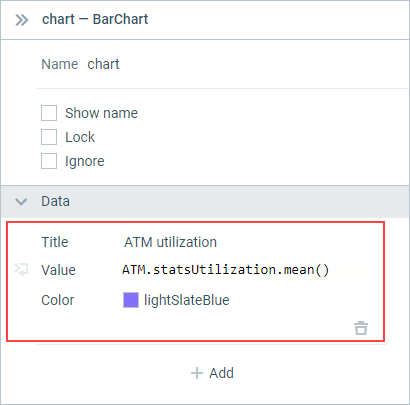
-
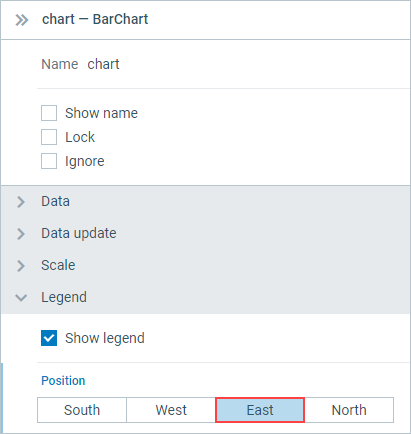
Change the Position of the chart’s legend to East in the Legend section of the Properties view.
-
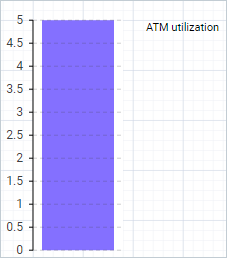
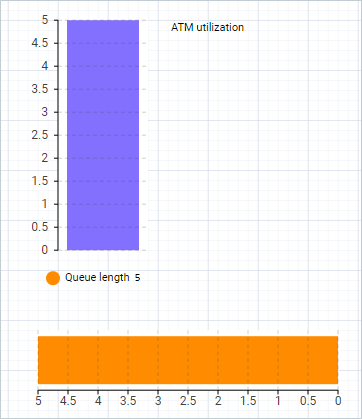
Now resize the chart as shown in the figure below:
Add a bar chart to indicate mean queue length
-
Add another bar chart in the same way. Resize it to look like the one in the figure below.
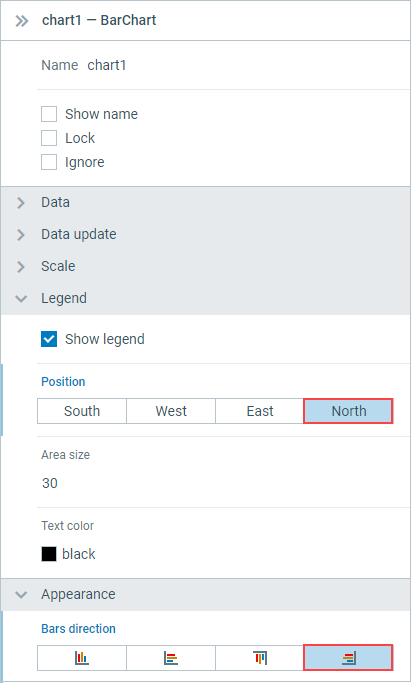
- Expand the Legend section of the Properties view and change the position of the chart’s legend to North.
-
In the Appearance section, choose the last option in the Bars direction property to make bars grow to the left.
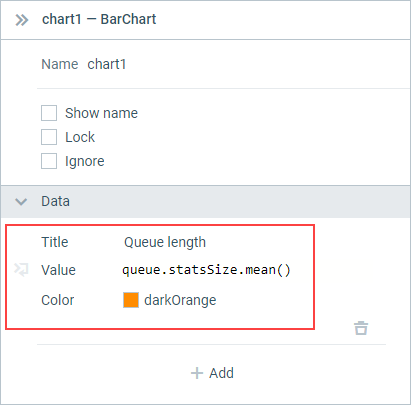
- Go to the Data section of the chart’s properties.
-
Change the Title to Queue length and Value to queue.statsSize.mean().
Here statsSize is the data set of type StatisticsContinuous that collects the statistics on the Queue size.
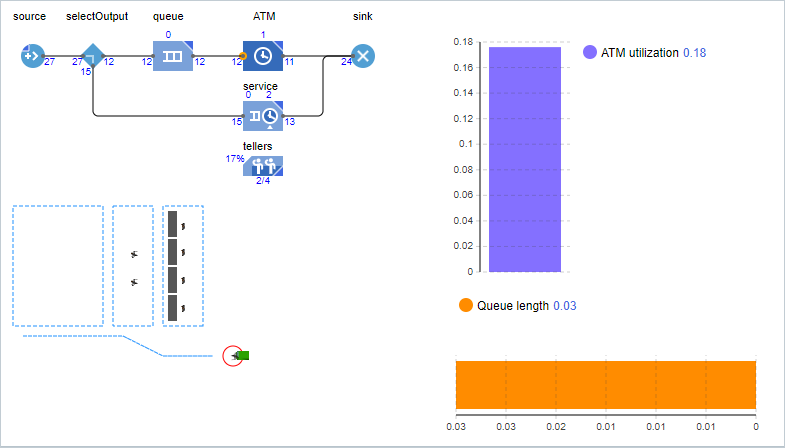
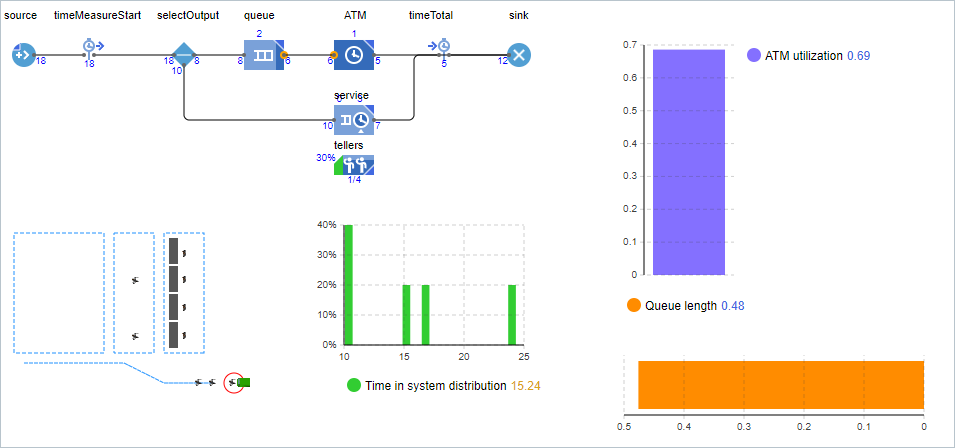
Run the model and observe the ATM utilization and mean queue length with new created charts.
We want to know how much time customer spends in a bank. We will collect time statistics using AnyLogic  Process Modeling Library library blocks
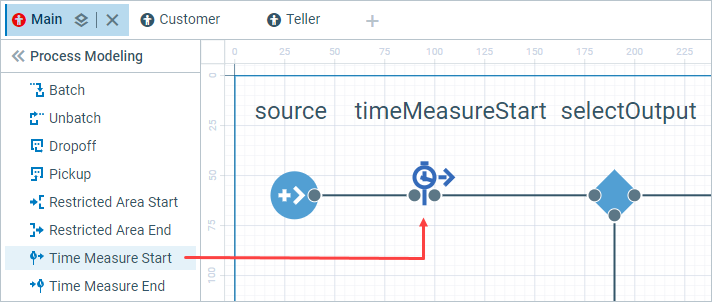
  TimeMeasureStart and
  TimeMeasureEnd. To measure the time agents spend in a particular section of the flowchart, we have to place these blocks at the entry point and at the exit point of this section. TimeMeasureStart block stores the time when an agent passed through it, while TimeMeasureEnd block measures the time an agent spent inside the specified section of the flowchart after passing the corresponding TimeMeasureStart block.
Add time measurement blocks to the flowchart.
- Adjust the flowchart to make space for a new block between source and selectOutput.
-
Open the Process Modeling Library palette and add the TimeMeasureStart block in the resulting space. Make sure that the ports of the block are properly connected.
- Move block sink to the right and rearrange the connection between service and sink to make space for a block after the connector.
-
Drag the TimeMeasureEnd block into the graphical editor and place it before the sink block. Make sure that the ports of the timeTotal block are properly connected both to ATM and service blocks.
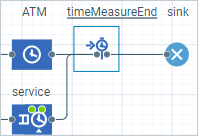
- Name the block timeTotal.
Every
TimeMeasureEnd block must have at least one TimeMeasureStart block specified in its properties to calculate the time distribution for agents.Specify our
timeMeasureStart block in its TimeMeasureStart blocks parameter.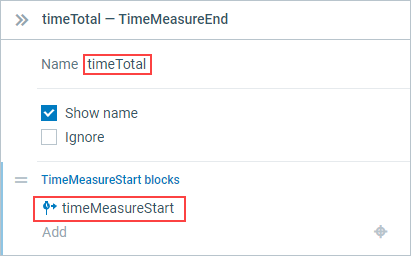
Add a histogram to indicate the collected statistics
-
Open the Analysis palette. Drag the
 Histogram element from the palette into the graphical editor.
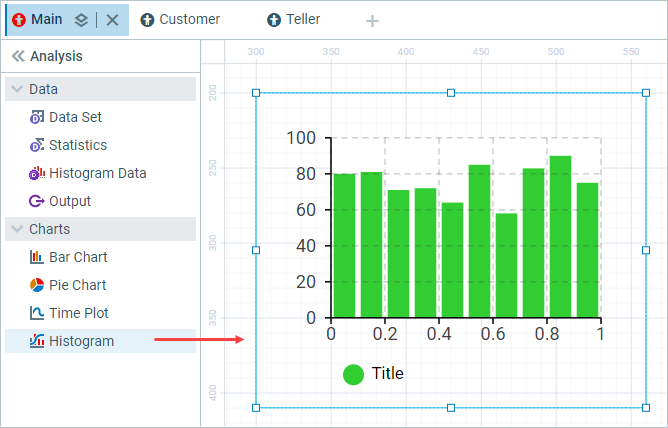
- Go to the Data section in the histogram’s properties. Change the data item’s Title to Time in system distribution.
-
Type timeTotal.distribution in the Data field.
timeTotal is the name of the
TimeMeasureEnd block that collects the distribution of time agents spend in the system.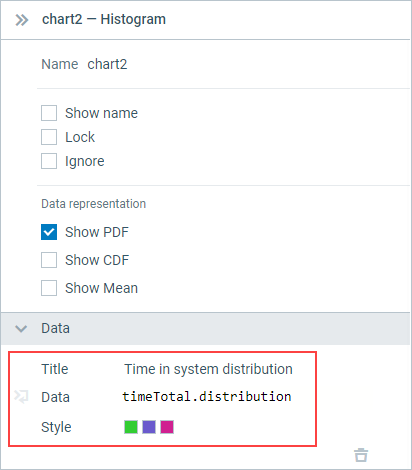
Run the model. Set virtual time mode and observe distribution of customer’s time in system.
-
How can we improve this article?
-