


AnyLogic supports a special type of functions — table functions. A table function is a function defined in table form. You can make it continuous by interpolating and/or extrapolating. You may need table functions to define a complex nonlinear relationship that cannot be described as a composition of standard functions, or to bring experimental data defined as a table function to a continuous mode.
Table functions work in the following way: the user defines a function by providing a number of (argument, value) pairs, i.e., a number of base points on the XY chart. AnyLogic builds the table function based on the given data and the chosen interpolation type. A function call with a value passed as a function argument will return a (possibly interpolated) value of the function. A number of behaviors are supported for cases where the argument is outside the original argument range.
To define a table function
- Drag the
 Table Function element from the
  Basic Elements palette to the graphical editor.
 - Go to the Properties view to specify the function properties.
- Specify the name of the function in the Name edit box.
-
Define data for the table function in the Table data section of the element properties. There are two options:
- To load table data from an AnyLogic database already imported to your model, select Loaded from database and specify the source table using the Database query field. Click create to open the Database reference dialog. Click the Table field and select the required table from the list. If needed, define the conditions for selecting particular values from the database table in Choice conditions. Click OK. Back in the Table data section, specify the Argument column and Value column by selecting the database table columns from the drop-down lists.
- You can also enter table data manually. When Loaded from database is not selected, a table is visible where each (argument, value) pair can be specified in an individual row. To add a row, click
 Add. To define a pair of values, enter the argument value in the Argument cell and the function value in the Value cell. To remove a value pair, hover over the corresponding row and click the
  Delete row button to the right.
- Specify how the table function should be interpolated using the Interpolation drop-down list in the general section of the properties.
- Specify how the table function should behave when its argument is out of range using the Out of range drop-down list in the general section of the properties.
- General
-
Name — The name of the table function. The name is used to identify and access the function.
Show name — If selected, the function name is displayed on the presentation diagram.
Ignore — If selected, the table function is excluded from the model.
Interpolation — Specifies how the table function is interpolated:
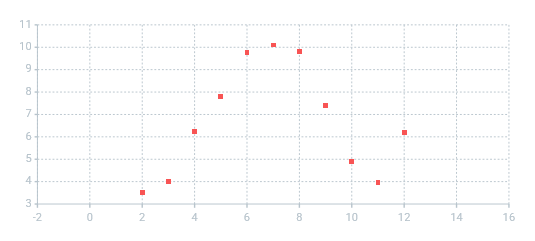
- None — No interpolation applied.
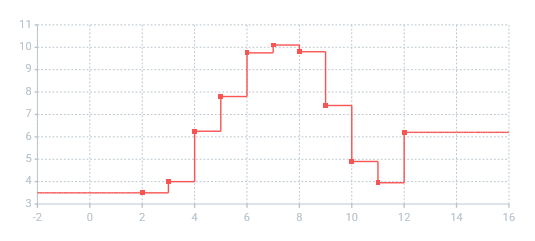
- Step — The function value between two points is the same as in the point with lower argument value.
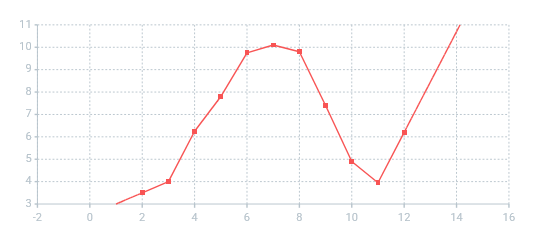
- Linear — Points are connected with straight-line segments.
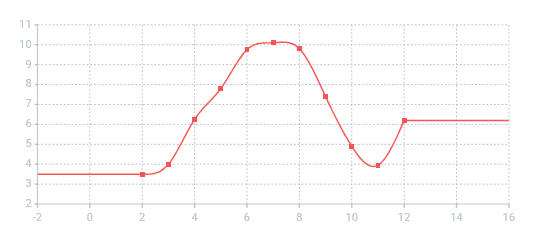
- Spline — Points are connected with 4th-order polynomial segments. For each point, the 0th, 1st, and 2nd derivatives of the right and left segments are equal. The 2nd derivative at the end points equals zero.
- Approximation — The resulting function is a polynomial of an Order you specify in the edit box on the right, formed so that the sum of the root-mean-square error at the points is minimized.
Out of range — Specifies the table function behavior in the infeasible area (when its argument is out of range):
- Error — A runtime error is raised.
- Nearest — The function is extrapolated using the nearest valid argument.
- Repeating — The function is extrapolated by making it periodic with the function range as the period.
- Custom — The function returns a custom value defined in the Value field to the right.
- Extrapolate — The function is extrapolated outside the range in accordance with the interpolation type.
- Table data
-
Table — [Visible when Loaded from database is not selected] Can be used to manually define the data of the table function. Each (argument-value) pair is specified in an individual row of the table. The following actions are available:
Add,  Copy,
Copy,  Paste, and Delete; you can also rearrange the rows using
  .
.Loaded from database — If selected, allows you to load data from a preloaded AnyLogic database added to this model.
Database query — [Visible when Loaded from database is selected] Opens the Database reference menu:
- Table — Here you can select the table of the specified AnyLogic database that contains the required data.
- Choice conditions — Here you define one or more conditions that will specify the particular values to be selected from the specified table column.
Argument column — Here you select the argument column of the database table.
Value column — Here you select the value column of the database table.
- Preview
-
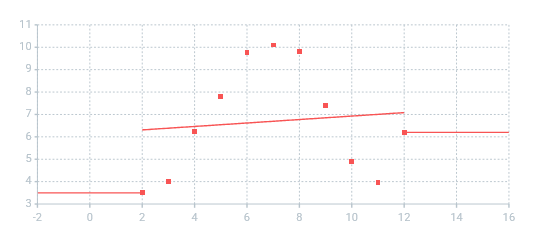
Here you can see the function preview: the plot of the table function.
The red area on the chart shows the function’s infeasible area.
- Expert
-
Access — The level of access to the table function:
- public — the function can be accessed from anywhere
- private — the function can be accessed from this agent type only
- protected — the function can be accessed from this agent type and its subclasses
- default — the function can be accessed from anywhere within this model
System dynamics units — If selected, you will be able to specify measurement units for the value returned by this function in the edit box to the right. Having specified the units, you may perform unit checking to find out dimension inconsistencies in your model.
Visible — If selected, the table function icon is visible in the presentation animation at model runtime.
To get the value of a table function for a given argument, call the table function like any other function by its name, passing the argument value as the function parameter. For instance, if you have a table function named lookup1 in your model, to get the function value for the argument 5, call:
lookup1(5);
Alternatively, you can use the function get(double x) of the table function. For the example above, the function call would be:
lookup1.get(5);
Both functions are identical. They return the table function value corresponding to the given argument, subject to the currently set interpolation type and out-of-range handling. If the function only supports discrete values (provided as the argument set) and no interpolation is allowed, calling the function with an argument that does not match any argument entry will result in an exception being thrown.
Table functions can be interpolated.
To set up the function interpolation type
- Select the table function in the graphical editor or in the Projects view.
- In the Properties view, choose the corresponding interpolation type from the Interpolation drop-down list.
- None — No interpolation applied.
- Step — The function value between two points is the same as in the point with lower argument value.
- Linear — Points are connected with straight-line segments.
- Spline — Points are connected with 4th-order polynomial segments. For each point, the 0th, 1st, and 2nd derivatives of the right and left segments are equal. The 2nd derivative at the end points equals zero.
- Approximation — The resulting function is a polynomial of an Order you specify in the edit box on the right, formed so that the sum of the root-mean-square error at the points is minimized.
The possible interpolation types are listed below.
| Interpolation type | Description and example |
|---|---|
| None |
No interpolation applied.
|
| Step |
Step interpolation. The function value between two points is the same as in the point with lower argument value.
|
| Linear |
Linear interpolation. Points are connected with straight-line segments.
|
| Spline |
4th order spline interpolation. Points are connected with 4th-order polynomial segments. For each point, 0th, 1st, and 2nd derivatives of the right and left segments are equal. The 2nd derivative at the end points equals zero.
|
| Approximation |
The resulting function is a polynomial of an Order you specify in the edit box on the right, formed so that the sum of the root-mean-square error at the points is minimized.
|
The feasible area of a table function is the defined set of points or the range of the interpolated function. You should define what happens when a table function argument falls outside the feasible area. The supported behavior types are as follows:
- Error — If the argument falls outside the feasible area, a runtime error is raised and an error message box is displayed.
- Nearest — The function is extrapolated using the nearest valid argument, i.e., for all arguments to the left (right) of the range, the function takes the value it has at the leftmost (rightmost) point.
- Repeating — The function is extrapolated by repeating, i.e., it is made periodic with the function range as the period.
- Custom — If the argument falls outside the feasible area, the table function returns a custom value defined in the Value edit box below.
- Extrapolate — The function is extrapolated outside the range in accordance with the interpolation type.
To define the function behavior in the infeasible area
- Select the table function icon in the graphical editor or in the Projects view.
- In the Properties view, select the corresponding function behavior type from the Out of range drop-down list.
-
How can we improve this article?
-