


The  GIS Map element allows you to display and manage GIS (Geographic Information System) maps in your models. You will find it in the
  Space Markup palette.
Currently the GIS Map element only supports tiled maps. These are downloaded in real time from online map services, such as OpenStreetMap. They are made up of small, usually square images — tiles — that are placed seamlessly side by side to visualize the map.
With the GIS Map element, you can add points, routes, and regions to the tiled map.
The GIS Map is based on the geographic coordinate system and uses the cylindrical Mercator projection. It distorts the size and shape of large objects as the scale increases from the equator to the poles, where it becomes infinite.
When you add a GIS Map element to an agent’s graphical diagram, a default tiled map loads automatically so you can start using the map right away.
When you add a GIS Map, the GIS space type is selected for all nested agents.
To add a GIS map
-
Drag the GIS Map element from the GIS section of the Space Markup palette onto the graphical editor.
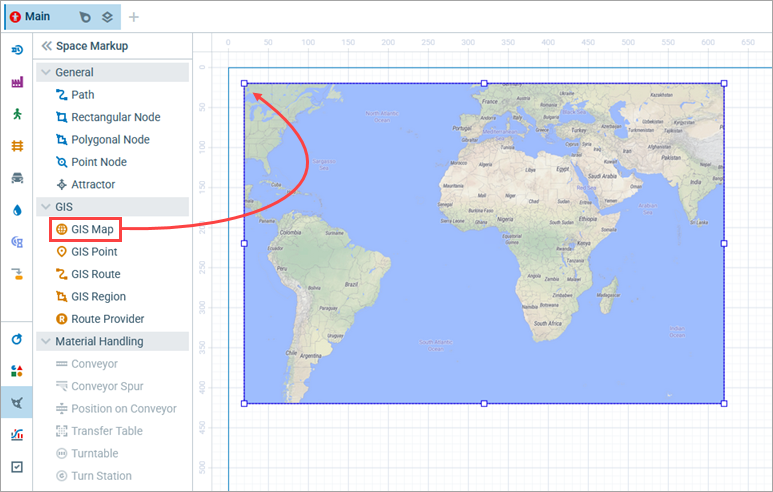
- Now you can move and resize the GIS Map element. It is a standard practice to fill the entire model window with it.
- Next, you can edit the map itself. For example, you can navigate through the map, pan it, or zoom it to select the area to be displayed in the model window.
- Then you can search for locations to add to your model.
- You can place the GIS markup elements on the map using the search results or adding them manually from the Space Markup palette.
- Using GIS markup elements or code, you can then place agents on the map.
- By default, the routes are built using the AnyLogic server. You can opt for straight lines, or create the routes with graph data or code, in the Routes section of the map properties.
- General
-
Name — The name of the element used to identify and access it from code.
Lock — If selected, the element is unresponsive: it will ignore mouse actions at model design time. To select the element, click its icon in the elements view.
- Tiles
-
Show tiles — This option is selected by default, so you can use a GIS map provided by AnyLogic as soon as you add it to the graphical diagram. Deselect this option if you do not want the tile layer to be visible.
Custom tile provider — If you want to use a custom online tile map service, select this option and provide a URL for the service in the text field below. The URL for the tiles should look like this: https://tile.openstreetmap.org/[zoom]/[x]/[y].png. It handles requesting the tile with the appropriate X- and Y-coordinates and zoom level from the tile server, for example: https://tile.openstreetmap.org/9/150/192.png. For details on the URL scheme, see the OpenStreetMap wiki page.
- Routes
-
Route provider — Here you select how the routes are built:
AnyLogic — The AnyLogic route provider. Used by default. Allows you to select the road type.
Routing graph — Select this option to upload a file storing data for your routing graph.
Straight lines — Routes are built as direct lines between route points.
Custom — Allows you to create your own route with code.Road type — [Visible only if AnyLogic is selected] Select the road network type for your map:
Car
Rail
Bike
FootRouting — [Visible only if AnyLogic or Routing graph is selected] Select Shortest or Fastest depending on how you want your agents to behave in the network.
Routing graph — [Visible only if Routing graph is selected] Allows you to upload a file storing data for your routing graph.
If route is not found — [Visible only if AnyLogic or Routing graph is selected] When a route cannot be created (typically this happens when the requested route does not exist), AnyLogic can:
Use straight route — Approximate the route with a straight line and continue running the model.
Show error — Notify you about the problem and stop.Custom route provider — [Visible only if Custom is selected] Insert code here to create your own route.
- Search
-
Custom search bounds — Sets the currently visible GIS map area as the custom search area and allows you to redefine its coordinates. You will be able to launch the model with any other area visible at startup, with the search performed within the defined bounds. If the specified agent(s) cannot be located within the selected area, the nearest outside location(s) with the same name(s) will be selected.
The area is defined based on the coordinates for its bottom left and top right corners:Bottom latitude — The latitude of the bottom left point.
Left longitude — The longitude of the bottom left point.
Top latitude — The latitude of the top right point.
Right longitude — The longitude of the top right point. - Center and scale
-
Here you can define the coordinates for the center of the visible map area and the scale of the map manually. You can also pan and zoom the map using the map edit mode.
Center — The center of the map defined with its latitude and longitude.
Scale — Scale of the map projection, 1:<specified value>, such as 1:10000.
- Appearance
-
Border color — The color of the outer border of the element. Click the control to adjust it using the color picker.
Fill color — The color of the map area that is visible when Show tiles is not selected.
- Position and size
-
Level — The level to which this element belongs.
Position and size —
X — The X coordinate of the top left corner of the element.
Y — The Y coordinate of the top left corner of the element.
Width — The width of the element, in pixels.
Height — The height of the element, in pixels. - Actions
-
 Add — Here you can specify a trigger that will start the code execution.
On click — Enter Java code to be called every time a user clicks the element at model runtime. If there are several elements overlapping at the click point, the click will interact with the topmost element only. By default, the code returns false.
Local variables:
self — The element itself.
clickx — The X-coordinate of the click relative to the element coordinates.
clicky — The Y-coordinate of the click relative to the element coordinates. - Visibility and presentation
-
Visible — If selected, the element is visible in the presentation at model runtime.
Agent presentation — If selected, the element is included in the agent presentation. This means that if the agent hosting this control is embedded in another agent, the control will remain visible in that higher-level agent.
- Expert
Generalization — The degree of simplification for routes and regions at runtime:
Current map scale — The level of detail shown depends on how zoomed in or out the map is. At smaller scales (zoomed out), shapes and routes are simplified to avoid clutter and improve performance. At larger scales (zoomed in), more detail is preserved so features appear accurate and precise.
Absolute precision (in meters) — The maximum allowed deviation from the real-world features. Lower values provide more accuracy, while higher values allow better performance and reduced data size.
To enter and exit the map edit mode
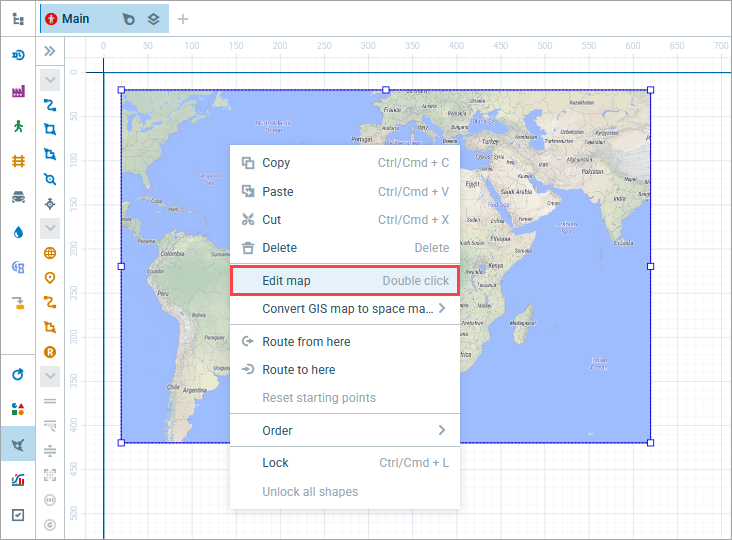
- Double-click a map, or right-click it and select Edit map from the context menu. The rest of the graphical editor will become grayed out.
- To select the area of the map you want to use for the model, pan or zoom the map.
- When you finish editing, click the grayed-out area of the graphical editor or right-click the map and select Finish map editing from the context menu.
You can edit the properties of multiple markup elements at once, for instance, change their appearance or lock their positions on the map.
To select several elements on the map
- Hold down the Ctrl key and click the markup elements on the map one by one to select or deselect them.
- You can also select multiple elements by holding down the Shift key and clicking them.
You can navigate a GIS map both at model design time and at model runtime.
At design time, edit mode allows you to see the map scale and the mouse pointer coordinates in the bottom right corner, as well as select a part of the map that you want to be displayed at runtime.
To enter and exit the map edit mode
- To enter the map edit mode, either double-click the map or right-click it and select Edit map from the menu.
- The rest of the graphical editor will become grayed out. You can now pan or zoom the map.
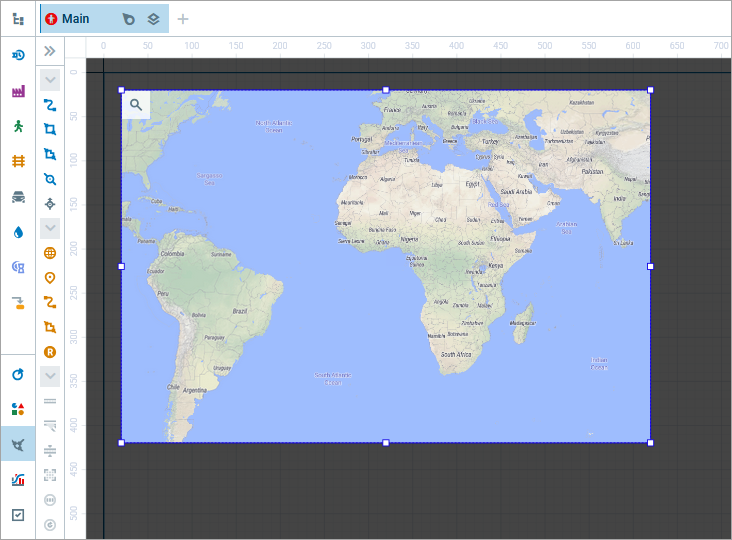
- To exit the map edit mode, either click the grayed-out area of the graphical editor or double-click the map. Alternatively, right-click the map and select Finish map editing from the menu.
To pan the map
- Enter the map edit mode.
- Click the map and, holding the left button down, move the mouse.
- If you right-click, and, holding the right button down, move the mouse, you will pan the entire graphical editor with the GIS map still in edit mode.
- When finished panning, exit the map edit mode.
To zoom in or out
- Double-click the map to enter edit mode. The rest of the graphical editor will become grayed out.
- To zoom in, move the mouse wheel away from you; to zoom out, move the mouse wheel toward you. The map will zoom in or out at the cursor position. To zoom in or out at a different location, first pan the map. If you are not in the map edit mode, moving the mouse wheel will scroll the entire graphical editor.
- When finished zooming, exit the map edit mode.
At runtime, you can navigate the GIS map in practically the same way as at design time: hold down the left mouse button and move the mouse to pan, or move the mouse wheel to zoom.
Using functions, you can change a map’s zoom, pan, or center coordinates dynamically during model runtime.
AnyLogic provides a GIS map tile layer that displays maps downloaded in real time from online services like OpenStreetMap. These maps are called “tiled maps” because they are composed of small, typically square images (tiles) placed seamlessly side by side. You can specify an online tiled map service in the Properties section of a GIS Map element: if the default service does not meet your needs, you can define a custom tile provider.
To enable a custom tile provider
- Select the GIS map element in the graphical editor and go to its Properties view.
- Open the Tiles section and select the Custom tile provider check box.
- In the text field that appears, provide the tile map service URL. The URL for the tiles should look like https://a.tile.openstreetmap.org/[zoom]/[x]/[y].png. It handles requesting the tile with the appropriate x and y coordinates and zoom level from the tile server, for example: https://tile.openstreetmap.org/9/150/192.png. For details on the URL scheme, see the OpenStreetMap wiki page.
Because a map is smaller than the objects it represents, map elements must be generalized — that is, simplified — to remain readable. While the AnyLogic GIS map tile layer has built-in generalization, elements you add to the map, such as routes or regions, may require manual generalization settings.
Depending on the generalization settings and the number of points used in an object, GIS routes and region boundaries may appear rough and jagged. Although increasing the number of points brings an object closer to its real scale and makes it appear smoother, this can also degrade model performance.
Just as it is not possible to display all the streets in every city when a map shows an entire country, fewer points of GIS routes and region boundaries are displayed at smaller map scales. If you zoom in on a map, you will see that as more points are displayed, a route or region becomes more detailed and less generalized. At design time, the generalization of routes and regions works the same way as tile layer generalization.
Below you can see two figures displaying the same route with different generalization settings. The first figure displays greater detail but will decrease model performance; moreover, agents following this route will rotate too often, making the animation look odd. The second figure provides a more acceptable level of detail.
Agent travel time along a route depends only on the actual route length. Route generalization does not affect travel time or accuracy — only the model animation and performance.
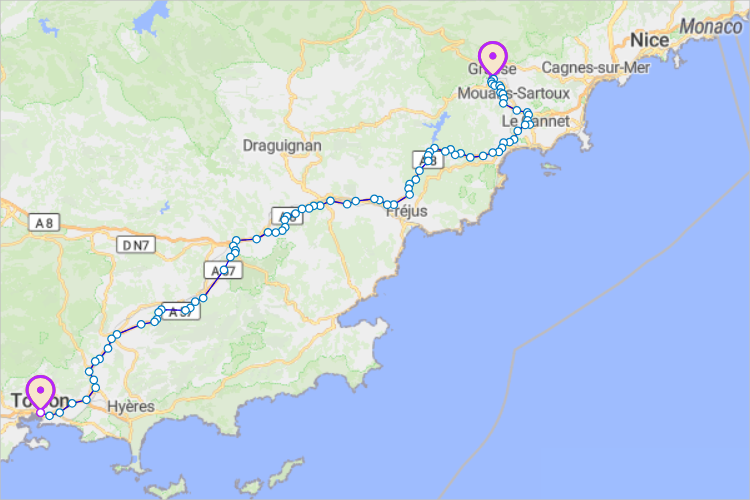 Grasse-Toulon route created with generalization corresponding to the map scale (1:1000000)
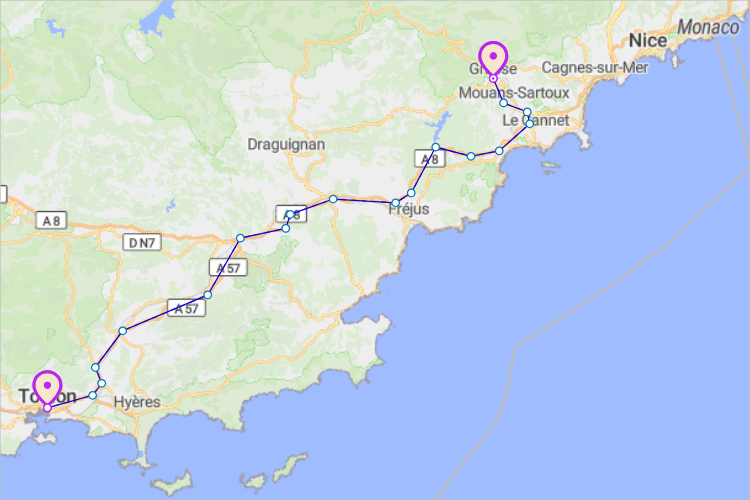 The same route created with generalization up to 1000 meters
To select the generalization type
- Select the GIS map element in the graphical editor and go to its Properties view.
- In the Expert section, select the Generalization mode: Current map scale or Absolute precision.
- In case you leave Current map scale selected, the precision of routes and regions on the map will be defined by the current scale of the map. At a greater map scale, its routes and regions will be more detailed and contain more points, and vice versa, at a smaller scale, the rendering of routes and regions will be less precise.
- If you select the Absolute precision mode, routes and regions will be rendered with the precision you enter in the edit box next to this option. The default precision is 1000 meters.
Using functions, you can access and manipulate many map characteristics.
- Map center
-
Function Description void setCenterLatitude(double centerLatitude) Sets the latitude of the map projection center.
centerLatitude — new latitude of the map projection center: (-90° ... (South) ... 0° ... (North) ... 90°)void setCenterLongitude(double centerLongitude) Sets the longitude of the map projection center.
centerLongitude — new longitude of the map projection center: (-180° ... (West) ... 0° ... (East) ... 180°)void setProjectionCenter(double centerLatitude, double centerLongitude) Sets the center of the map projection.
centerLatitude — the new latitude of the map projection center: (-90° ... (South) ... 0° ... (North) ... 90°)
centerLongitude — the new longitude of the map projection center: (-180° ... (West) ... 0° ... (East) ... 180°)void pan(int toEast, int toNorth) Moves the map projection center. Parameters are amounts of delta in the resulting offset. One horizontal delta is a half of longitude difference from map projection center to the west/east bound of projection. One vertical delta is a half of latitude difference from map projection center to the south/north bound of projection.
toEast — number of horizontal deltas to be added to the projection center, if positive, center is moved to the East, if negative — to the West.
toNorth — number of vertical deltas to be added to the projection center, if positive, center is moved to the North, if negative — to the South. - Map scale
-
Function Description void setMapScale(double mapScale) Sets the map projection scale.
mapScale — the ratio of display units to actual meters on the Earth’s surface: 1/100000 means “1 km in 1 cm”, and so on.void zoomIn() Increases the scale of the map projection by a factor of 2. void zoomOut() Decreases the scale of the map projection by a factor of 2. void fitBounds(double bottomLat, double leftLon, double topLat, double rightLon) Makes the map fit the specified bounds.
bottomLat — the latitude of the bottom bound of the visible area: (-90 ... (South) ... 0 ... (North) ... +90)
leftLon — the longitude of the left bound of the visible area: (-180° ... (West) ... 0° ... (East) ... 180°)
topLat — the latitude of the top bound of the visible area: (-90° ... (South) ... 0° ... (North) ... 90°)
rightLon — the longitude of the right bound of the visible area: (-180° ... (West) ... 0° ... (East) ... 180°) - Distances
-
Function Description double getDistance(double latFrom, double lonFrom, double latTo, double lonTo) Returns the distance between two given points (in meters).
latFrom — the latitude of the 1st point: (-90° ... (South) ... 0° ... (North) ... 90°)
lonFrom — the longitude of the 1st point: (-180° ... (West) ... 0° ... (East) ... 180°)
latTo — the latitude of the 2nd point: (-90° ... (South) ... 0° ... (North) ... 90°)
lonTo — the longitude of the 2nd point: (-180° ... (West) ... 0° ... (East) ... 180°)double getDistance(GISPoint fromPoint, GISPoint toPoint) Returns distance between two given points (in meters).
fromPoint — the 1st point.
toPoint — the 2nd point.double getDistanceByRoute(double latFrom, double lonFrom, double latTo, double lonTo) Calculates the length of the route (in meters), from one point to another. Uses the route provider to create a route.
latFrom — the latitude of the 1st point: (-90° ... (South) ... 0° ... (North) ... 90°)
lonFrom — the longitude of the 1st point: (-180° ... (West) ... 0° ... (East) ... 180°)
latTo — the latitude of the 2nd point: (-90° ... (South) ... 0° ... (North) ... 90°)
lonTo — the longitude of the 2nd point: (-180° ... (West) ... 0° ... (East) ... 180°)double getDistanceByRoute(GISPoint fromPoint, GISPoint toPoint) Calculates the length of the route (in meters), from one point to another. Uses the route provider to create a route.
fromPoint — the 1st point.
toPoint — the 2nd point. - Meters to length units ratio
-
Function Description double fromLengthUnits(double length, LengthUnits units) Converts the given length value from specified units to meters. Returns the length measured in meters.
length — the length value.
units — a constant defining the length units.double toLengthUnits(double length, LengthUnits units) Converts the given length value from meters to specified units. Returns the length measured in the given length units.
length — the length value.
units — a constant defining the length units. - Mouse navigation
-
Function Description boolean isMouseNavigationEnabled() Returns true if panning and zooming with a mouse are allowed, false otherwise. void setMouseNavigationEnabled(boolean mouseNavigationEnabled) Manages the ability to pan and zoom the map with a mouse.
mouseNavigationEnabled — visibility: if true — the mouse panning and zooming is allowed, if false — forbidden. - Routes
-
Function Description GISRoute getRoute(GISPoint start, GISPoint end) Creates a unidirectional route from one GIS point to another, allowing travel in a single direction only.
start — The GIS Point at the start of the route.
end — The GIS Point at the end of the route.GISRoute getRoute(GISPoint start, GISPoint end, boolean bidirectional) Creates a route between the specified GIS Points.
start — The GIS Point at the start of the route.
end — The GIS Point at the end of the route.
bidirectional — if true, the newly created GIS route will be bidirectional. If false, a one-way route will be created.GISRoute getRoute(double startLatitude, double startLongitude, double endLatitude, double endLongitude) Creates a unidirectional route from one GIS point to another, allowing travel in a single direction only.
startLatitude — The latitude of the route’s starting point.
startLongitude — The longitude of the route’s starting point.
endLatitude — The latitude of the route’s ending point.
endLongitude — The longitude of the route’s ending point.GISRoute getRoute(double startLatitude, double startLongitude, double endLatitude, double endLongitude, boolean bidirectional) Creates a route between specified points on a GIS map.
startLatitude — The latitude of the route’s starting point.
startLongitude — The longitude of the route’s starting point.
endLatitude — The latitude of the route’s ending point.
endLongitude — The longitude of the route’s ending point.
bidirectional — if true, the newly created GIS route will be bidirectional. If false, a one-way route will be created.IGISRouteProvider getRouteProvider() Returns the default route provider for all agents in this GIS space. Check out the API documentation on the GISRoute object to learn about other ways of creating a GIS route programmatically. - Search
-
Function Description List<GISPoint> search(String query) Searches the entire map for all points corresponding to the user’s query.
query — the query.List<GISNode> search(String query, boolean area, boolean visibleAreaOnly) Searches for all GIS nodes corresponding to the user’s query.
query — the query.
area — if true, the search results will be GIS regions, if false, GIS points.
visibleAreaOnly — if false, the search will include the entire map; if true, the search will be performed within the search bounds first, and then, if nothing was found, retried including the entire map. The search bounds are defined at design time, they are limited to the visible map area by default, but can also be specified as area coordinates.List<GISRegion> searchRegion(String query) Searches for all regions corresponding to the query.
query — the query.List<GISMultiRegion> searchMultiRegion(String query) Searches for all multiregions corresponding to the query.
query — the query.GISPoint searchFirst(String query) Searches the entire map and returns the first point matching the query.
query — the query.GISRegion searchFirstRegion(String query) Searches the entire map and returns the first region matching the query.
query — the query.GISMultiRegion searchFirstMultiRegion(String query) Searches the entire map and returns the first multiregion matching the query.
query — the query.void fitBounds(double bottomLat, double leftLon, double topLat, double rightLon) Makes the map fit the specified bounds.
bottomLat — the latitude of the bottom bound of the visible area: (-90 ... (South) ... 0 ... (North) ... +90)
leftLon — the longitude of the left bound of the visible area: (-180° ... (West) ... 0° ... (East) ... 180°)
topLat — the latitude of the top bound of the visible area: (-90° ... (South) ... 0° ... (North) ... 90°)
rightLon — the longitude of the right bound of the visible area: (-180° ... (West) ... 0° ... (East) ... 180°) - Shape position
-
Function Description double getX() Returns the X coordinate of the shape’s upper left corner. double getY() Returns the Y coordinate of the shape’s upper left corner. void setX(double x) Sets the X coordinate of the shape’s upper left corner.
x — the new value of the X-coordinate.void setY(double y) Sets the Y coordinate of the shape’s upper left corner.
y — the new value of the Y-coordinate.void setPos(double x, double y) Sets new coordinates for the shape’s upper left corner.
x — the new value of the X-coordinate.
y — the new value of the Y-coordinate. - Shape size
-
Function Description double getWidth() Returns the width of the shape, in pixels. double getHeight() Returns the height of the shape, in pixels. void setWidth(double width) Sets the width of the shape.
width — the new width value, in pixels.void setHeight(double height) Sets the height of the shape.
height — the new height value, in pixels.double getScaleX() Returns the scale of the shape along the X-axis. double getScaleY() Returns the scale of the shape along the Y-axis. void setScaleX(double sx) Sets the scale of the shape along the X-axis.
sx — the new value of the scale along the X-axis, 1 = keep original size.void setScaleY(double sy) Sets the scale of the shape along the Y-axis.
sy — the new value of the scale along the Y-axis, 1 = keep original size.void setScale(double sx, double sy) Sets the scale of the shape along both axes.
sx — the new value of the scale along the X-axis, 1 = keep original size.
sy — the new value of the scale along the Y-axis, 1 = keep original size.void setScale(double s) Sets the same scale for the shape along both axes.
s — the new value of the scale along both axes, 1 = keep original size. - Shape visibility
-
Function Description boolean isVisible() Checks the visibility of the shape. If the shape is visible, returns true, otherwise returns false. void setVisible(boolean v) Sets the visibility of the shape.
v — visibility: if true, the shape is set to be visible, if false, not visible.
-
How can we improve this article?
-